Prices

January 28, 2021
Hot Rolled Futures: How Close Are We to the Top?
Written by Jack Marshall
The following article on the hot rolled coil (HRC), scrap and financial futures markets was written by Jack Marshall of Crunch Risk LLC. Here is how Jack saw trading over the past week:
Hot Rolled
Price and forecast volatility continue to plague the ferrous markets, but how close are we to the top?
Hot rolled index spot price changes from week to week have risen continuously for the last six-plus months. The average weekly price increase has been approximately $27/ST over that period.
On a monthly basis the price average increase has been between $13/ST and $50/ST with the peak coming in December and the price increases progressively narrowing through to the month-to-date average in February coming in at roughly $22/ST. In December, the weekly spot index rose $220/ST as compared to a February month-to-date three-week change of $46/ST.
While we have yet to see a drop in the weekly spot price index over the period, the increases are becoming smaller.
We have also witnessed a significant shift in the month of February in the HR futures curve, as the participants have shifted their forecasts on the timing of a mean reversion in prices.
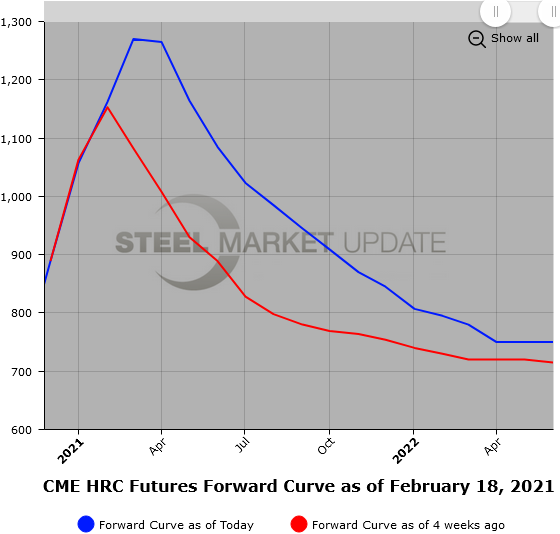
For comparison of the shifts in the HR futures curve, I have broken the monthly periods into three-month strips going out one year. On Feb. 1, the settlement values for HR Feb’21 and Jan’22 were $1,152/ST and $723/ST, which reflected a very steep backwardation in the curve equal to $429/ST. We can compare this to yesterday, Feb. 17, settlement values for HR Feb’21 and Jan’22 of $1,162/ST and $785/ST, which reflect a still steep backwardation in the curve equal to $377/ST narrower by $52/ST.
Also of note, if we take rolling three-month strips out 12 months, we can see the shifts between quarters.
To show the shifting calendar spread price values between rolling quarters, we can compare settles on Feb. 1 and Feb. 17, the front three-month strip average equaled $1,080/ST versus $1,222/ST (up $142/ST), the second three-month strip average equaled $843/ST versus $1,075/ST (up $232/ST), the third three-month strip average equaled $754/ST versus $924/ST (up $170/ST), and the fourth three-month strip average equaled $734/ST versus $815/ST (up $81/ST). The spread between average price values of the front three-month strip and the second three-month strip narrowed by $90/ST, while the subsequent spreads between the following quarters widened out by $62/ST and $89/ST. So, over the month of February, the shift in calendar spreads reflected a market view that prices likely would remain higher for longer than they did coming out of January. Likely due to recent experience with slower-than-expected recovery in manufacturing schedules due to ongoing supply chain issues and bottlenecks due to COVID. We can add likely delays due to late winter weather to the list. Bottom line tightness through the global and U.S. ferrous supply chain continues.
Below is a graph showing the history of the CME Group hot rolled futures forward curve. You will need to view the graph on our website to use its interactive features; you can do so by clicking here. If you need assistance with either logging in or navigating the website, please contact us at info@SteelMarketUpdate.com.
Scrap
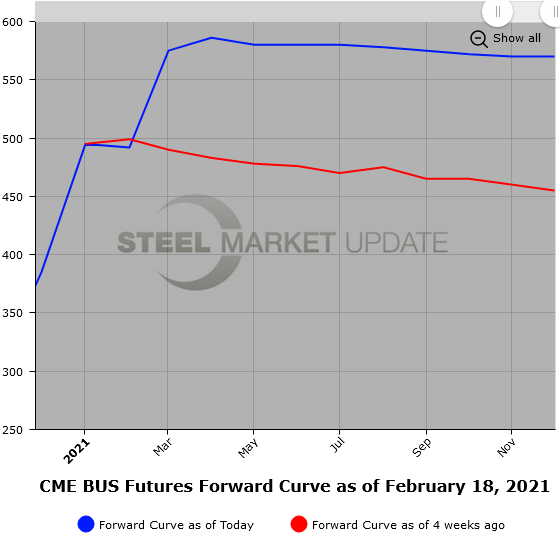
BUS futures have been bolstered by the big price increases in HR and the rollback of the backwardation as participants were surprised by the strong February settlement, which was basically sideways at $492/GT. Recent HR strength has kept the BUS well bid with the near date Mar’21 settling as high as $560/GT yesterday. Volumes have been a touch lighter as natural buyers have shown a good deal of reticence to pay the higher offers. The latest round of winter weather is not going to help as transport delays and supply chain issues could become a problem. Markets will be focusing on the return of China from their New Year’s break. The Apr’21 through Dec’21 BUS curve prices based on settlements are up over $115/ST, reflecting the strong price move in HR prices in that section of the futures curve.
Below is another graph showing the history of the CME Group busheling scrap futures forward curve. You will need to view the graph on our website to use its interactive features; you can do so by clicking here.