

Prices

March 31, 2022
Ferrous Futures: Volatility Calms and Volume Plummets as Price Moves Hinge on Ukraine
Written by David Feldstein
Editor’s note: SMU Contributor David Feldstein is president of Rock Trading Advisors. Rock provides customers attached to the steel industry with commodity price risk management services and market intelligence. RTA is registered with the National Futures Association as a Commodity Trade Advisor. David has over 20 years of professional trading experience and has been active in the ferrous derivatives space since 2012.
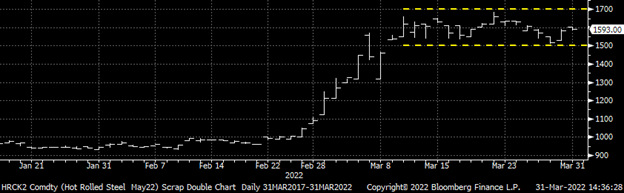
The rally in CME futures throughout 2021 was like nothing the futures and physical market had ever experienced. Over a twelve-month period from August ’20 to August ’21, the rolling 2nd month Midwest HRC future rallied from $500/st to over $1,900/st, a gain of almost 300% and more than doubling the previous high of $935 from June ’20. An average weekly gain of roughly 5.5%. Nothing so intense would ever be seen again. … Well, until last month. From the close on Friday February 18 through Tuesday March 15, the May HRC future gained $671!! An average of roughly 20.5% per week.
May CME Midwest HRC Future
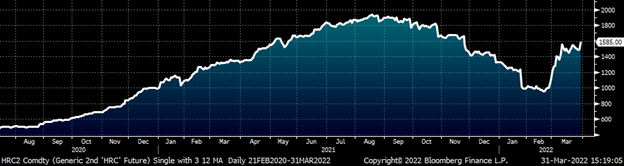
The relentless buying squeezed the shorts and forced liquidations as the CME’s increased margin rates further exacerbated the squeeze. This positive feedback loop – of shorts being squeezed, forcing the next margin call, forcing the next weakest short to meet the margin call or be squeezed out of their position – seemed like it would never end. Some of the rally had to do with domestic fundamentals that had led up to Cleveland Cliff’s price increase announcement on February 21. But it was the supply shock caused by Russia’s invasion of Ukraine that created a frenzied and chaotic eruption of buying across the commodities landscape. From oil to wheat to nickel, the price action, volatility and collateral damage was extraordinary. The London Metals Exchange had to halt trading in nickel futures for six trading days!
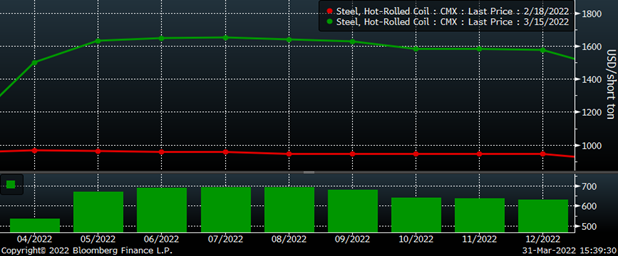
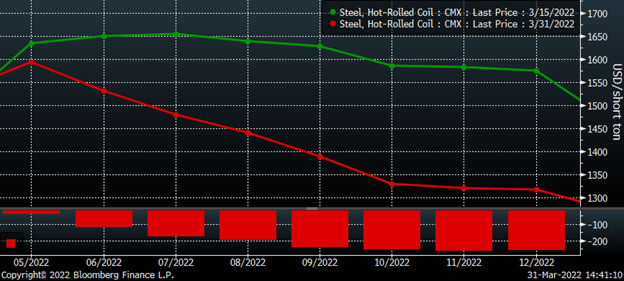
A number of anomalies have arisen on the ferrous front. One such was the $671 gain in the May CME future was also seen through all of the months into year-end with the curve maintaining its flattish shape. This was especially odd considering last year’s steep backwardation. However, during this brief period, many of the players that would have regulated the curve in these later months were left scrambling themselves or cautiously waiting for the fog of war to dissipate.
CME Midwest HRC Futures Curve
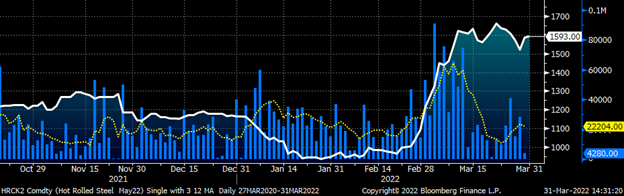
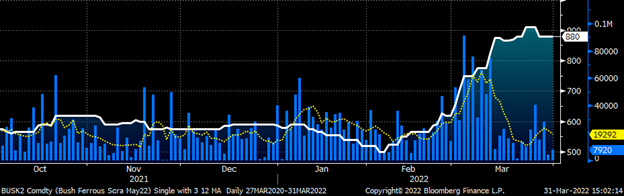
Volume exploded over the three week period. This chart of the May future shows the daily volume in tons across the curve with a five-day moving average in yellow. Note that since mid-March, volume has cratered. Trading has all but ground to a halt with only 4,280 tons trading yesterday and 9,080 tons trading today.
May CME Midwest HRC Future
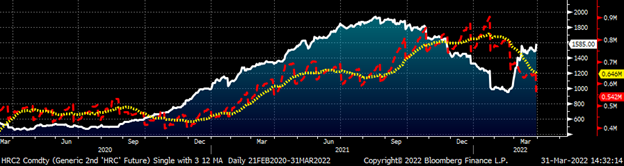
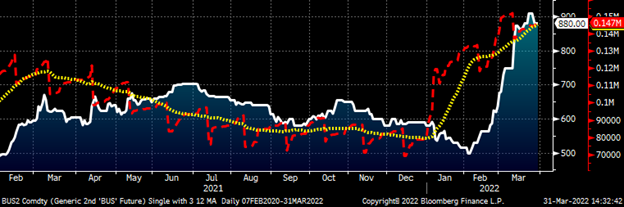
Since peaking at 903k in January, open interest (or the number of outstanding futures contracts) in HRC futures has plummeted leaving many concerned about the future of the futures market. Open interest has declined back to the levels seen last summer. In the chart below, open interest across the curve is show in red with a 22-day moving average in yellow. Flat rolled imports also dove in February, which might be related to some of the decline. But regardless, the experience in the futures market since February has not only shaken up the market but also might have permanently sidelined some market participants.
Rolling 2nd Month CME Midwest HRC Future
Since mid-March, the front of the curve has been range bound. You can see the May future below trading between $1,500 – $1,700 since.
May CME Midwest HRC Future
However, the flat curve from March 15 has quickly adjusted into a steep backwardation. On March 15, the spread between the May and December future was $58. As of today’s settlements, the spread had expanded to $276.
CME Midwest HRC Futures Curve
Trading in CME busheling futures experienced some similarities to HRC futures. Prices ripped higher with relentless buying on heavy volume, which has since seen a sharp decline into month’s end.
May Busheling Future $/lt
One key difference between the busheling and HRC futures market is that open interest in busheling has been expanding since the start of the year while HRC has been falling sharply. For busheling, this indicates a technically strong bull market and a market participant or participants building a relatively sizable long position. On the day of the expiration of the March future, the busheling futures set a new all-time record for open interest at 151,920 tons.
Rolling 2nd Month Busheling Future $/lt
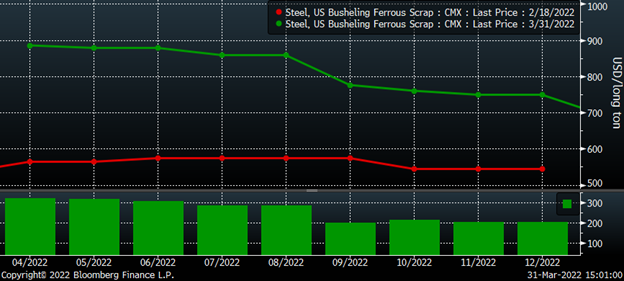
The CME busheling futures curve has seen gains of around $300 per month through August. The price action in busheling has been justified by the shock to pig iron supply with Ukraine and Russia, roughly 60% of domestic pig imports, taken offline by Russia’s invasion. However, has the busheling futures market gone too far too fast? Should busheling be trading at $100 above Chinese HRC? Or $240 above Turkish scrap? Will these paradoxes be resolved as was seen in the HRC futures curve above?
CME Busheling Futures Curve $/lt
With so much of the rally in HRC, busheling and commodities the result of the Russian invasion induced supply shock, it should come as no surprise that futures markets continue to ignore fundamentals instead focusing on the latest developments regarding war and peace in Ukraine.
The lead headline Tuesday morning:

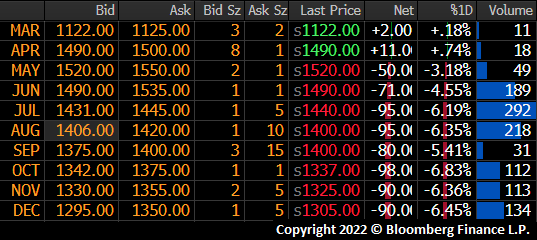
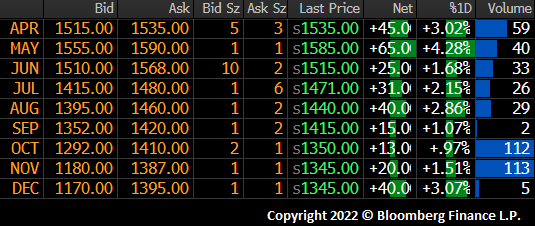
Tuesday’s HRC futures settlement:
The lead headline Wednesday morning:

Wednesday’s HRC futures settlement:
With so much riding on the war in Russia, it is no surprise that volume in HRC and busheling futures has reversed so quickly. The futures market moved rapidly higher, but the physical market has followed closely with a two-week lag. If the futures were to plummet, would the physical market follow it back down? As shown above, a lot can happen in three weeks, and I am extremely curious to know what I will be writing about in my next SMU article three weeks from now.
Disclaimer: The content of this article is for informational purposes only. The views in this article do not represent financial services or advice. Any opinion expressed by Feldstein should not be treated as a specific inducement to make a particular investment or follow a particular strategy, but only as an expression of his opinion. Views and forecasts expressed are as of date indicated, are subject to change without notice, may not come to be and do not represent a recommendation or offer of any particular security, strategy or investment. Strategies mentioned may not be suitable for you. You must make an independent decision regarding investments or strategies mentioned in this article. It is recommended you consider your own particular circumstances and seek the advice from a financial professional before taking action in financial markets.


