

Prices

October 27, 2022
HRC, BUS Futures: Making New Lows as 14-Month Decline Seeks Support
Written by David Feldstein
Editor’s note: SMU Contributor David Feldstein is president of Rock Trading Advisors. Rock provides customers attached to the steel industry with commodity price risk management services and market intelligence. RTA is registered with the National Futures Association as a Commodity Trade Advisor. David has over 20 years of professional trading experience and has been active in the ferrous derivatives space since 2012.
The October hot-rolled coil (HRC) future expired earlier this week at $756 per net ton, a $43 decline versus September. Since breaking below $800/ton in September, HRC futures have yet to find a support level, thus continuing to trend lower. The rally from $500/ton in August 2020 to $1,900/ton took 12 months. It has now seen 14 months of declines since peaking above $1,900/ton last August. Are we nearing a bottom? Is the final capitulation stage of the cycle coming? The lowest priced December future has made new recent lows each of the last two trading days with 120 tons traded earlier today at $668/ton.
December CME Hot-Rolled Coil Future $/ton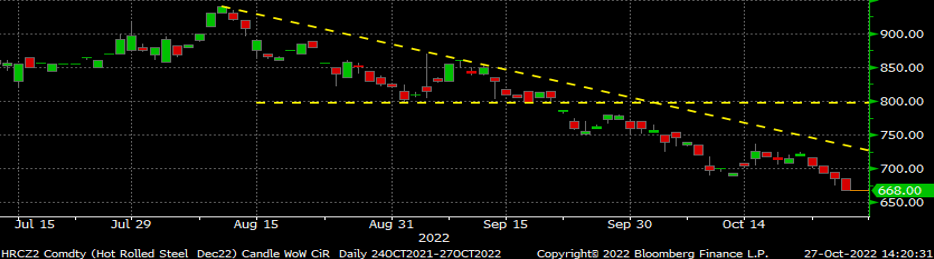
Since the expiration of the September future on Sept. 28, the curve has fallen by $80 to $112 in the months of December ’22 through September ‘23.
CME HRC Futures Curve $/ton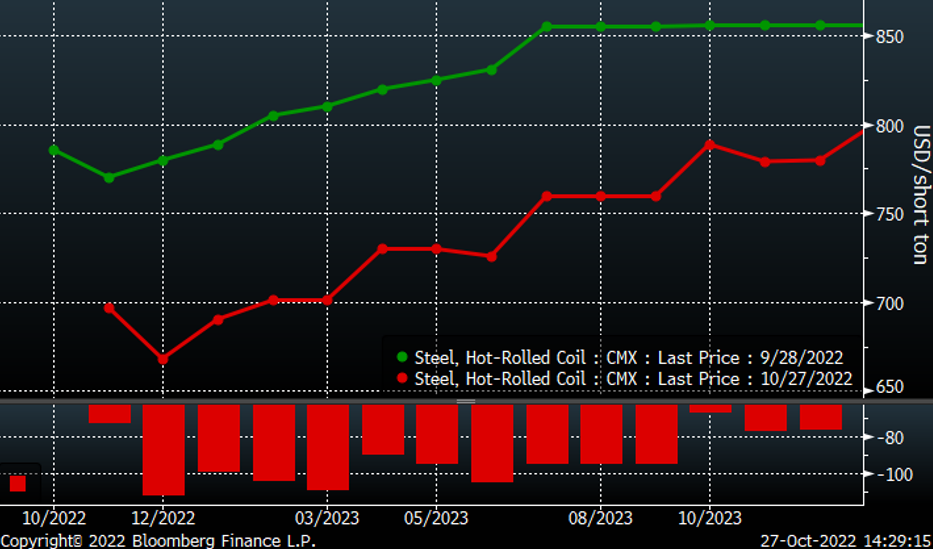
One positive development of late has been an increase in open interest, which is the number of outstanding futures contracts, or tons in the case of the CME HRC futures. This chart below of the rolling 2nd month HRC future includes open interest in red with a 22-day moving average in yellow. Open interest’s alligator-teeth-looking pattern in red occurs because at each month’s expiration when all of the expiring month’s open interest comes off at settlement. As you can see, open interest climbed higher along with last year’s epic rally. Open interest peaked just above 900,000 tons in January and has steadily declined since along with prices until bottoming out the day after September’s expiration at 397,000 tons. Open interest grew in October, peaking just above 500,000 tons, roughly a 20,000 ton MoM increase. Moreover, open interest stood at 431,000 tons the day after October’s expiration, up from 397,000 tons in September. Perhaps this is a sign (OEM) forward buying is returning to the market.
Rolling 2nd Month CME HRC Future $/ton & Open Interest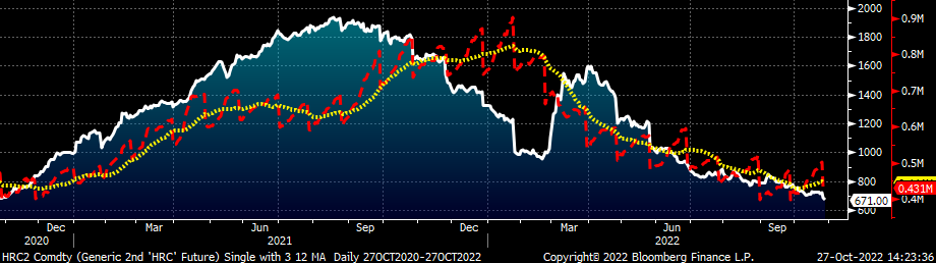
The chart below shows the November HRC future’s steady decline since Memorial Day in white with daily volume in blue and the 22-day moving average of daily volume in yellow. Volume picked up toward the end of October with the 5-day average peaking just below 30,000 tons per day on Oct. 24.
November CME HRC Futures $/ton w/Aggregate Curve Volume & 22-Day Avg.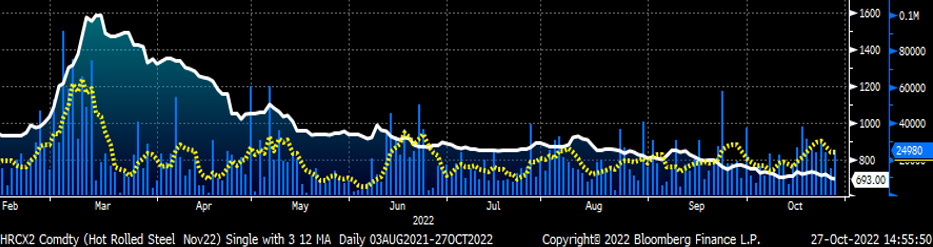
The rolling 2nd Month CME busheling future, now December, also continued lower today falling to $365 per long ton, its lowest since November 2020. Open interest has remained steady around 135,000 tons.
Rolling 2nd Month CME Busheling Future $/long ton & Open Interest (Red)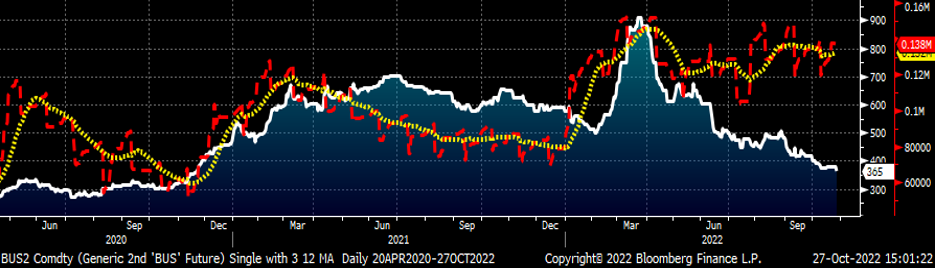
The front month November contract settled today at $375/long ton, indicating another monthly decline, albeit this month would only be $10/long ton. Trading volume improved in recent weeks with the bulk of the volume trading in the months of 2023. Today, open interest stood at 137,540 long tons with 75% of that spread out relatively evenly across each month of 2023, so congratulations to the busheling contract for continuing to improve its liquidity.
Rolling Front Mo. CME Busheling Future $/long ton w/Agg. Curve Volume & 22-Day Avg.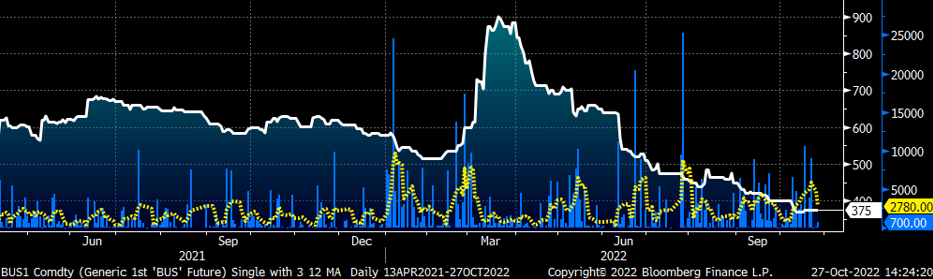
There are a lot of interesting developments across ferrous markets. The tight spread between busheling and Turkish scrap is one of those headscratchers indicating either a rally in busheling or a steep sell-off in Turkish scrap is coming in the near-term.
Front Month Busheling ($/long ton) and Turkish Scrap ($/metric ton) Futures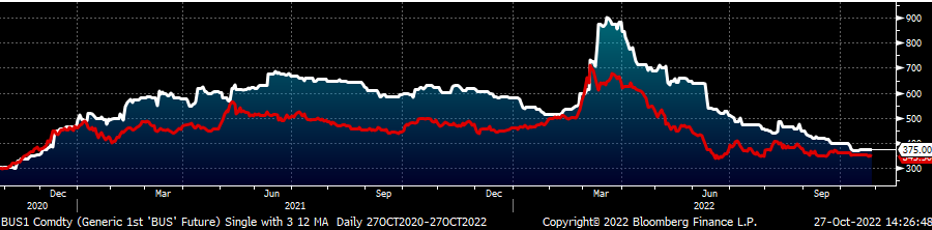
The SGX 2nd month iron ore future continues to fall to new lows settling today at $81.55/metric ton. Bust out those cost curves as here we go again with production cuts coming at some point.
Rolling 2nd Month SGX Iron Ore Future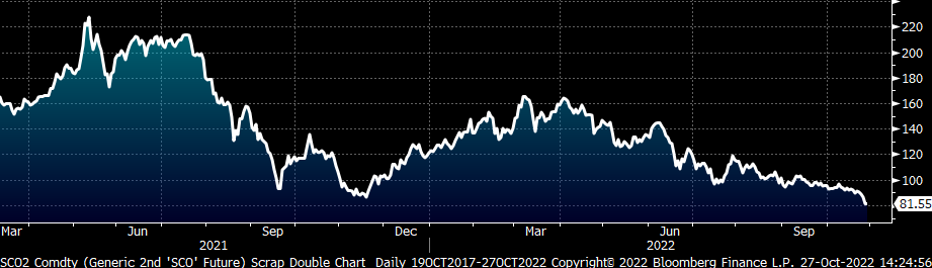
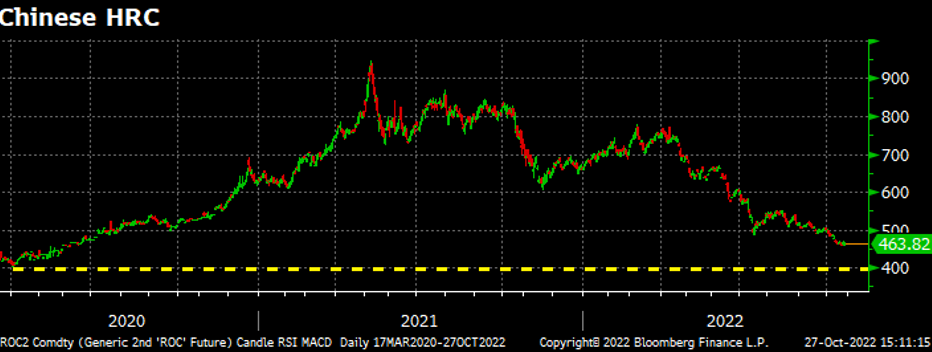
Chinese HRC futures in net tons shown below trading down to around $460/ton earlier today, not far from its Covid low at $400/ton.
There are some curious developments in financial markets as well. For the rest of this article, it is recommended you turn on the song “Winds of Change” by the Scorpions as you read.
If you can’t, at least try to whistle the intro a little.
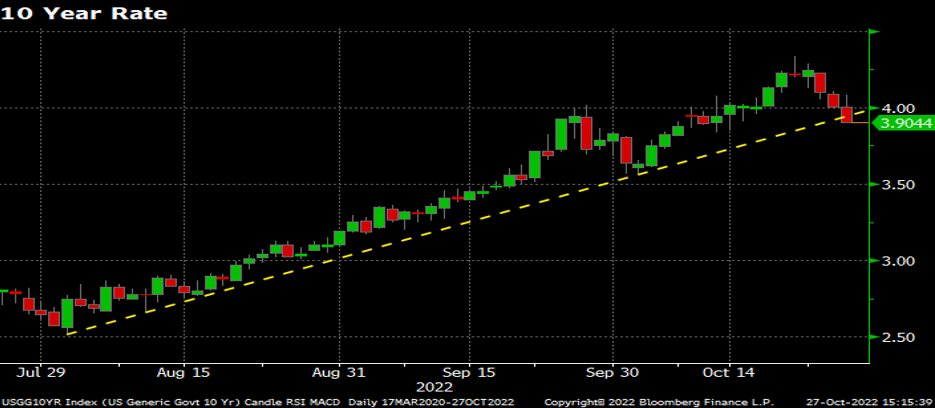
The chart below shows the 10-year US Treasury rate breaking below its multi-month trend line. Watch how it trades following tomorrow’s release of the US Personal Consumption Expenditures (PCE) Index at 7:30am CST, perhaps a catalyst that sends rates lower.
“The future’s in the air, can feel it everywhere, blowing with the wind of change.” -The Scorpions
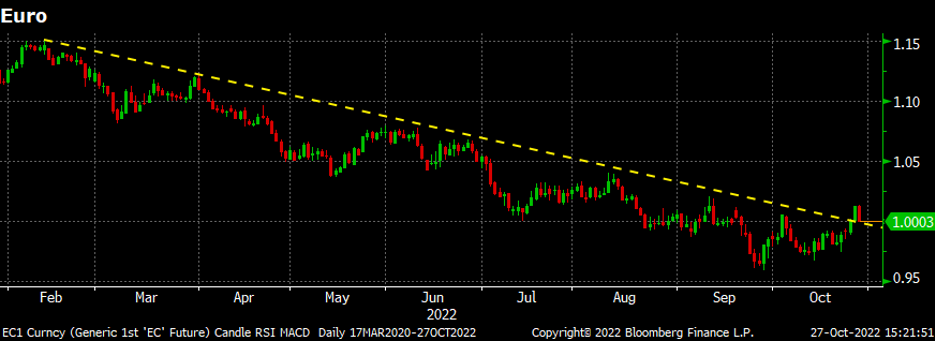
The European Central Bank raised rates 75 basis points today to the highest in a decade. Yesterday, the euro broke back above parity as well as its downtrend that started in February.
Besides an excuse to listen to The Scorpions Wind of Change, why should you care?
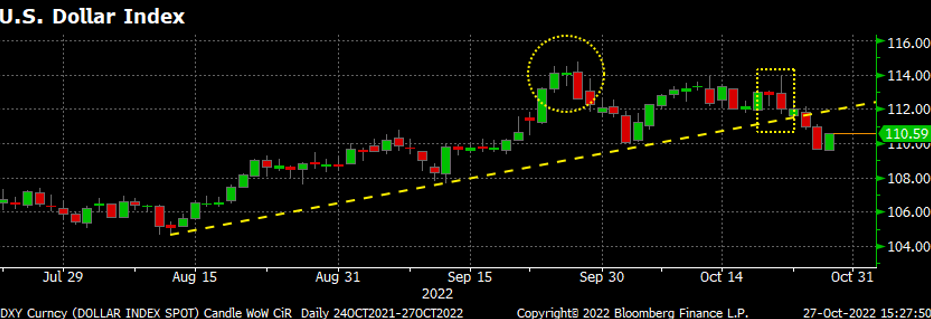
The US dollar’s relentless rally has weighed on commodity prices and if it reverses lower, as its chart indicates, it could be a tailwind for commodity prices and even a risk-on rally in equities, all of which could lift sentiment.
Let’s get technical: The circle shows a doji-star and the rectangle a hammer with confirmation, both trend reversal patterns. Then add in the uptrend line being pierced and it’s a solid look for a trend reversal. Add in the patterns in US Treasuries and the euro lending even more credence to the technical analysis. Did someone say Credence? No, only one tune per article.
I’ve been studying and working with technical patterns since first starting my trading career in 2000 and have easily logged over 10,000 hours on the charts. I can confidently tell you these patterns provide a solid 50% chance of being right. Keep one eye on these products and another for the market to turn. It just might be coming up over there on the horizon.
Disclaimer: The content of this article is for informational purposes only. The views in this article do not represent financial services or advice. Any opinion expressed by Feldstein should not be treated as a specific inducement to make a particular investment or follow a particular strategy, but only as an expression of his opinion. Views and forecasts expressed are as of date indicated, are subject to change without notice, may not come to be and do not represent a recommendation or offer of any particular security, strategy or investment. Strategies mentioned may not be suitable for you. You must make an independent decision regarding investments or strategies mentioned in this article. It is recommended you consider your own particular circumstances and seek the advice from a financial professional before taking action in financial markets.
By David Feldstein, Rock Trading Advisors


