• Skip to main content

    Market Data

    SMU's November at a glance

    Written by David Schollaert


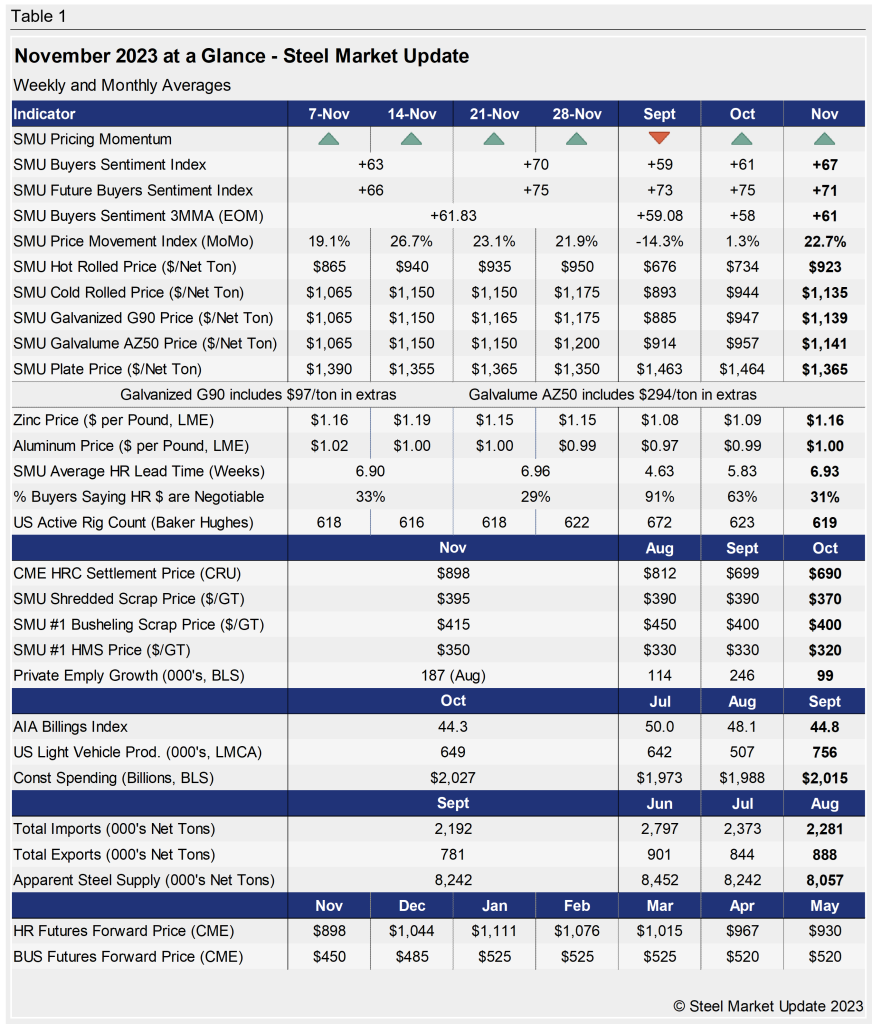
    Steel prices continued to rally last month on the back of repeated mill price increases after tags reached a 2023 low of $645 per ton in late September. Hot-rolled coil (HRC) prices ended November at an average of $923 per ton ($46.15 per cwt), rising by $140 per ton during the month.

    The SMU Price Momentum Indicator for sheet products continued pointing Higher throughout November after shifting from the Lower in September. The trend remained in place as tags kept rallying in response to repeated mill price hikes throughout November.

    The Price Momentum Indicator on plate, which had been pointing lower since September, shifted to Higher largely in response to mill increase notices at the close of the month. Despite the improvement, signs of weakness due to waning demand persist.

    Raw material prices have fluctuated somewhat but were again mostly sideways last month, except for scrap. Scrap prices improved on average in November, up between $15-30 per ton. Despite some movement mid-way through the month, zinc and aluminum spot prices were largely stable, remaining within historical levels. You can view and chart multiple products in greater detail using our interactive pricing tool here.

    The SMU Steel Buyers Sentiment Index remained positive and continued to recover a bit, edging up during the month. Current Buyers Sentiment rose from +61 in October to +67 on average in November. Future Sentiment hovered at an average of roughly +71, down slightly from the prior month’s reading of +75.

    Our Steel Buyers Sentiment 3MMA Index (measured as a three-month moving average) had been eroding over the past four months, falling to +58 in October, but recovered to +61 on average last month.

    Hot rolled lead times averaged 6.93 weeks in November, up from 5.83 weeks the month prior. SMU expects lead times to hover around current levels, but market chatter suggests they could increase a bit more through December and into the first quarter of 2024 as inventory management takes precedence at the year-end. A history of HRC lead times can be found in our interactive pricing tool as well.

    About 31% of HRC buyers reported in November that mills were willing to negotiate on prices, down noticeably from roughly 63% in October as mills drove prices higher.

    Key indicators of steel demand are still showing some signs of weakness overall and are nowhere near the bullish levels some had shown earlier in the year. While there are some backlogs in the energy and construction sectors, and the UAW strike on Detroit’s “Big Three” automakers ended, demand in December and into early 2024 seems controlled, especially as buyers appear to be pushing back on a bit on the most recent round of mill price hikes.

    See the chart below for other key metrics for November:
    David Schollaert

    Read more from David Schollaert

    Latest in Market Data

    Global raw steel output down again in September

    Global raw steel production slowed for the fourth straight month in September, according to the latest figures from the World Steel Association (worldsteel). After falling 3.4% month over month (m/m) in August, the total volume of raw steel produced around the globe ticked down 1.2% to an estimated 142.4 million metric tons (mt) in September. Output was down just 0.1% year over year (y/y). On a 12-month moving average (12MMA) basis, annual production has averaged 149.3 million mt per month across the past year. This was down 1.6% y/y and was the lowest 12MMA since May (Figure 1). Before September 2025, annual output had generally hovered between 152 million mt and 154 million mt for over three years, similar to pre-pandemic levels.

    Drilling activity is flat again in the US, recovers in Canada

    The latest tally of active drilling rigs held steady in the US for a third straight week, while activity rose in Canada this week, according to oil and gas rig count data published by Baker Hughes. The US rig count remained unchanged at 603 rigs this week, maintaining a 17-month high. Compared to this time last year, there are 53 more rigs in operation today. Canada’s count rose by three to 220 rigs this week, recovering after a short-lived easing the prior week. Activity is up compared to the same week of 2025, with 21 more rigs operating today.

    Final Thoughts: Is the steel market now tighter than in 2021?

    "Now, the problem is no longer the price. The problem is having access to steel." That would have made a good lead. But I can’t take credit for it. Those (very quotable) words are from Cleveland-Cliffs Chairman and CEO Lourenco Goncalves during the steelmaker’s quarterly earnings conference call on Monday. For a while, I thought the shortages we'd been hearing about might be mostly a problem for small- and mid-sized buyers. But we’re seeing even some of the biggest steel buyers talking openly about supply problems.

    Metalformers grow more cautious in October

    Metalformers’ economic outlook softened in the Precision Metalforming Association (PMA) October Business Conditions Report. Still, the bulk of respondents continued to expect stable conditions. The monthly survey of 80 metalforming companies in the US and Canada provides an economic indicator for manufacturing over the next three months. “While this month’s survey reflects increased caution about the near-term economic outlook, the energy and investment on display at FABTECH this week tell a broader story about our industry’s resilience,” commented Mark Getsay, PMA’s managing director. Participation at the event, Getsay said, “demonstrates metalformers’ continued commitment to investing in new technologies, developing their workforce and strengthening their competitiveness for the future.”

    AIA: Architecture business conditions weaken further in September

    Architecture firms reported weaker business conditions in September, according to the latest Architecture Billings Index (ABI) release from the American Institute of Architects and Deltek. The share of firms reporting declining billings was the largest since May. The September ABI fell two and a half points from August to a four-month low of 44.7. The ABI has been in contraction for all but two months since August 2022, indicating continually weakening business conditions following the post-pandemic rally. The ABI is a typical leading indicator of nonresidential construction activity, leading construction spending by approximately 9–12 months.