

Manufacturers/End Users
April 15, 2024
US light-vehicle sales slip in March, still better than a year ago
Written by David Schollaert
US light-vehicle (LV) sales rose to an unadjusted 1.44 million units in March, up 4.6% vs. year-ago levels, the US Bureau of Economic Analysis (BEA) reported. The year-on-year (y/y) growth in domestic LV sales came in despite a 1.3% month-on-month (m/m) decline.
On an annualized basis, LV sales were 15.5 million units in March, down from 15.8 million units the month prior, and behind the consensus forecast, which called for a a jump to 15.9 million units.
Auto sales were lower as the first quarter closed out, driven largely in part due to continued elevated prices and interest rates. While the average transaction price (ATP) is down more than 2% y/y, income growth and interest rates have lagged.
The trend has concentrated demand in the non-luxury segment of the market, which accounted for most of the 2.7% y/y growth in sales for the first quarter of the year.
The average daily selling rate (DSR) was 53,260 – calculated over 27 days – up from March 2023’s 53,260 daily rate. Passenger vehicle sales increased 1.3% y/y, while sales of light trucks moved higher by 5.4% over the same period. Light trucks accounted for 80% of last month’s sales, slightly above its share of sales in one year ago.
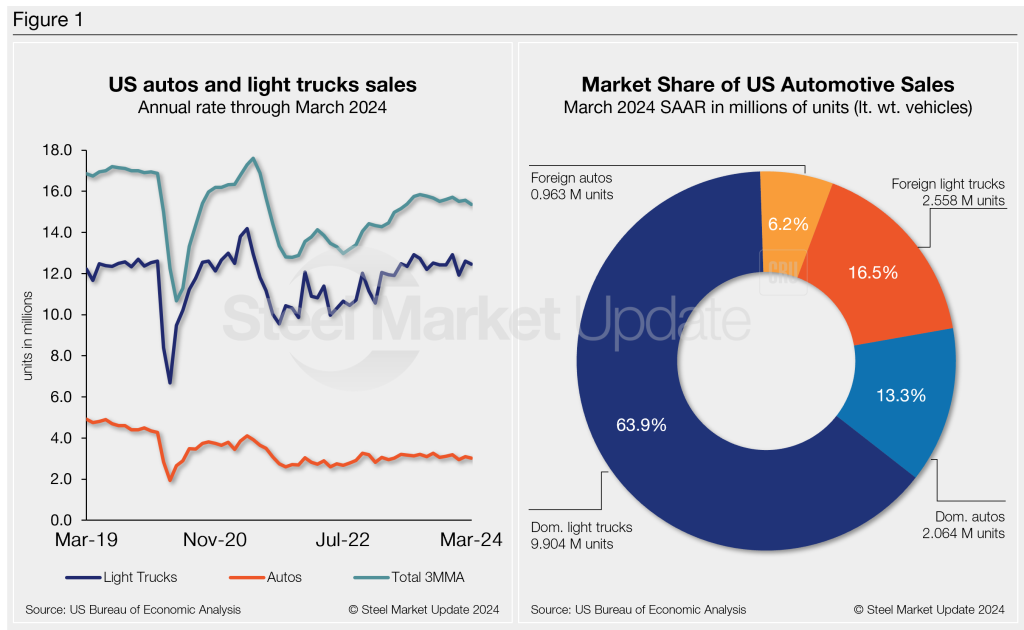
Below in Figure 1 is the long-term picture of sales of autos and lightweight trucks in the US from 2019 through March 2024. Additionally, it includes the market share sales breakdown of last month’s 15.5 million vehicles at a seasonally adjusted annual rate.
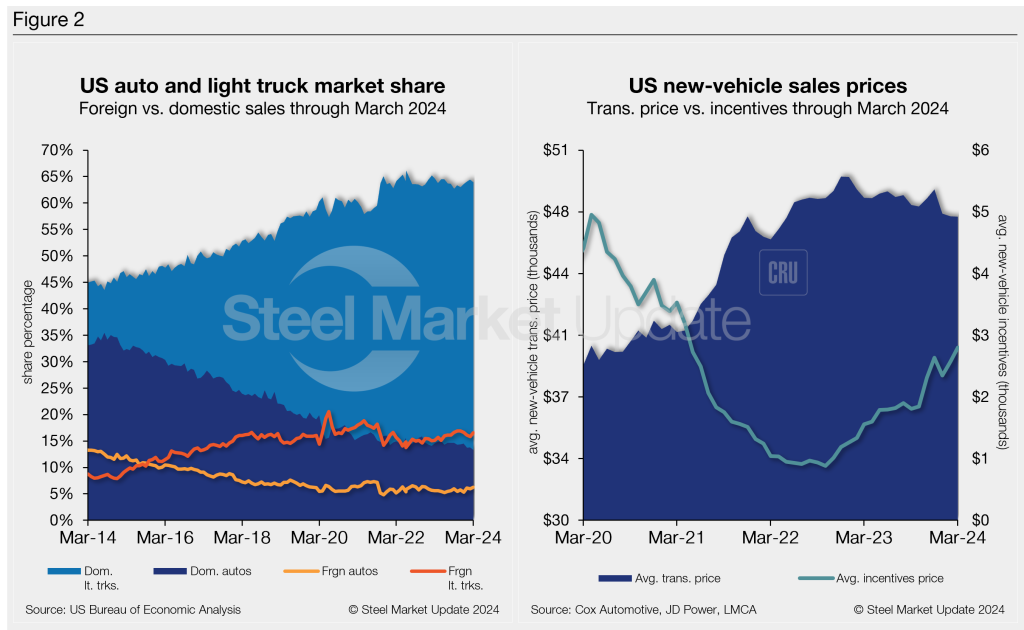
The new-vehicle ATP was $47,218 in March, down 0.31% from February. Last month’s ATP was also 2.2% (-$1,071) below the year-ago period, according to Cox Automotive data.
Incentives moved higher for the second straight month after they had decreased in January. March’s incentives hit a 35-month high at $2,800, up 9.2% vs. February, and 6.3% above the previous high of $2,633 set in December. With the m/m increase, incentives are nearly 6% of the average transaction price. Incentives are up roughly 80%, or $1,242, y/y.
In March, the annualized selling rate of light trucks was 12,462 million units, down 1.1% vs. the prior month but still 4.6% better y/y. Annualized auto selling rates saw similar dynamics, down 2.3% yet up 0.3% in the same comparisons.
Figure 2 details the US auto and light-truck market share since 2013 and the divergence between average transaction prices and incentives in the US market since 2020.
Editor’s Note: This report is based on data from the US Bureau of Economic Analysis (BEA), LMC Automotive, JD Power, and Cox Automotive for automotive sales in the US, Canada, and Mexico. Specifically, the report describes light-vehicle sales in the US.


