Analysis
July 19, 2024
July energy market update
Written by Brett Linton
In this Premium analysis we cover North American oil and natural gas prices, drilling rig activity, and crude oil stock levels. Trends in energy prices and rig counts are an advanced indicator of demand for oil country tubular goods (OCTG), line pipe, and other steel products.
The Energy Information Administration’s (EIA) July Short-Term Energy Outlook (STEO) was released earlier this week, forecasting spot prices, production, and inventories for crude oil and natural gas. Crude oil prices are expected to slightly increase through the remainder of the year, a trend reversal from their previous forecast. Natural gas prices are still forecast to move higher on the back of recent lows. You can view the latest EIA Short-Term Energy Outlook here.
Oil and gas spot prices
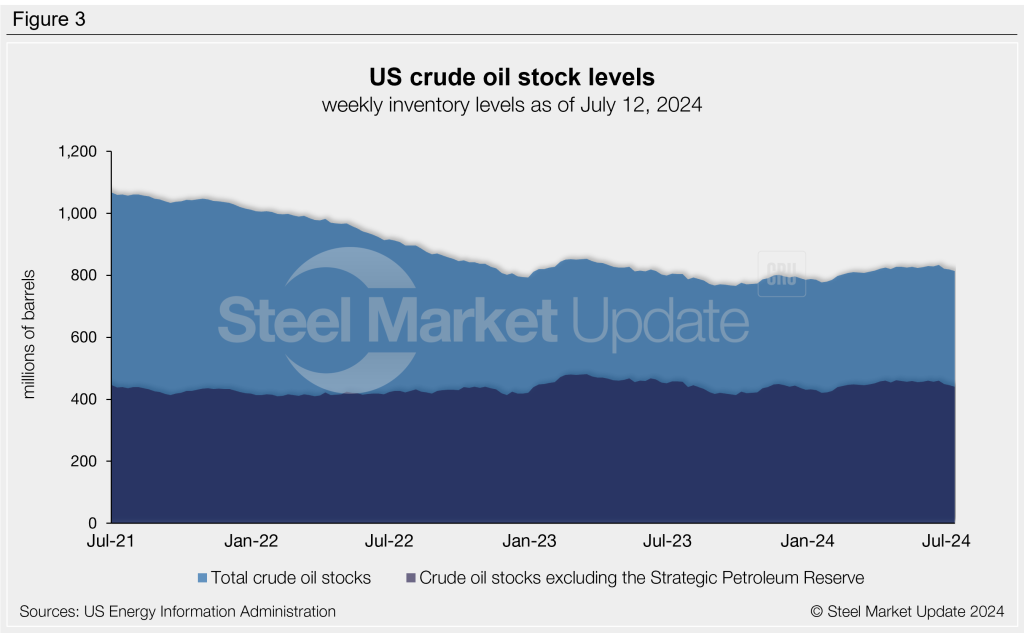
The weekly West Texas Intermediate oil spot market price has remained rangebound across the last two years, hovering between $70-90 per barrel (b) since September 2022. The spot price stands at $83.44/b as of last week (Figure 1) and has trended upwards since early June. The EIA expects oil spot prices to average $89/b in the second half of 2024, up from their previous estimate of $84/b. They attribute this upwards pressure on prices to continued global oil inventory withdrawals as a result of OPEC+ production cuts.
Natural gas spot prices saw a bump in May and June following their historical lows. Recall that prices reached a 25-year low in mid-March of $1.40 per metric million British thermal units (mmBtu). The EIA attributed these low prices to historically high inventory levels due to reduced winter consumption. Natural gas prices stand at $2.26/mmBtu as of last week, following a peak of $2.73/mmBtu in mid-June. The July STEO forecasts natural gas to average $2.90/mmBtu in the second half of the year, up from their Q3 estimate of $2.60/mmBtu. This increase is supported by reduced production and increased seasonal demand from the electric power sector.
Rig counts
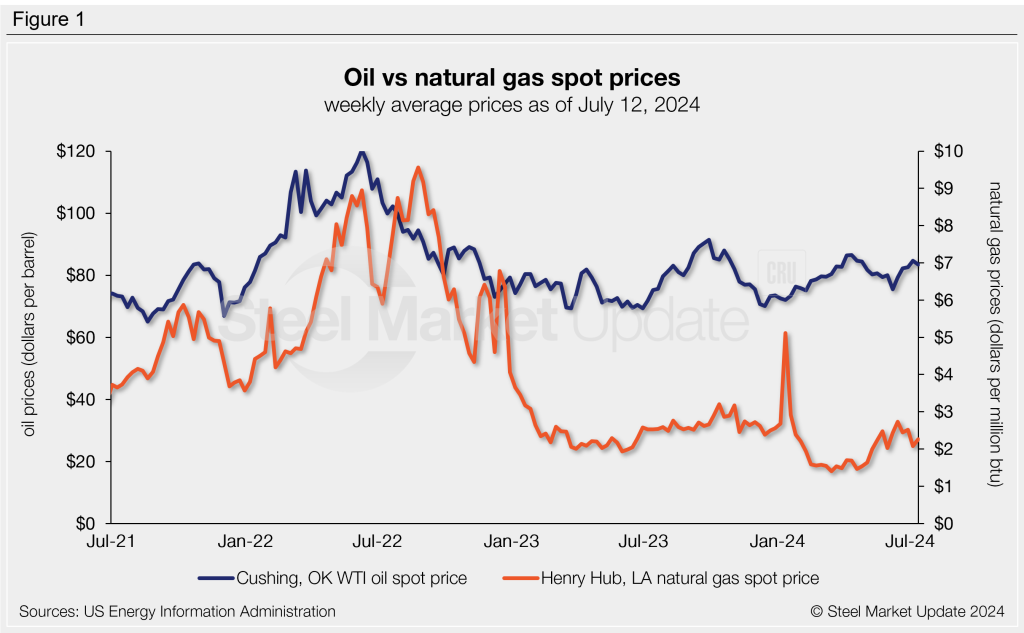
The number of active US oil and gas drill rigs has flattened over the last four weeks, remaining near a two-and-a-half-year low (Figure 2). The latest US count is 586 active drill rigs as of July 19, according to Baker Hughes. Active rig counts are 12% lower than levels seen one year ago.
Canadian rig activity continues to improve after bottoming out in May, now up to a four-month high of 197 rigs this week. As seen on the right chart in Figure 2, Canadian counts experience seasonal swings each spring as warmer weather sets in and thawing ground conditions limit access to roads and sites. The active Canadian rig count is up 5% compared to this time last year.
Stock levels
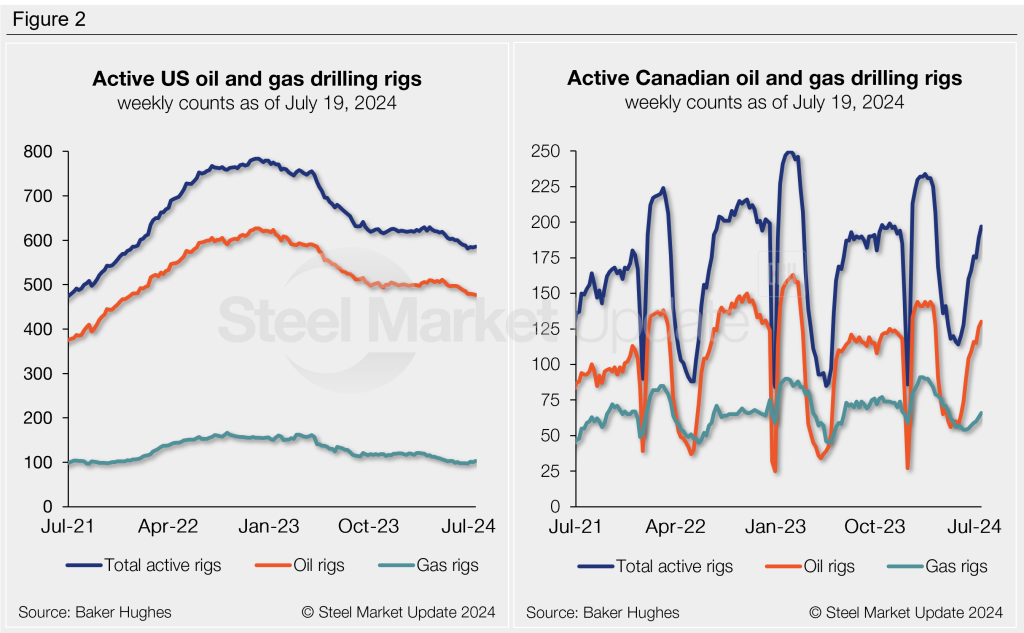
Following the 14-month high reported in our June energy update, US crude oil stocks have begun to ease over the past few weeks. Through July 12, stock levels eased to a 16-week low of 814 million barrels. July stocks are 3% higher than they were at the start of this year, and 1% greater than levels one year ago (Figure 3).