Analysis
March 13, 2025
Apparent steel supply increased in January to a multi-year high
Written by Brett Linton
The volume of finished steel entering the US market in January climbed to the highest level recorded in two and a half years, according to our analysis of data recently released by the US Department of Commerce and American Iron and Steel Institute (AISI).
Referred to as ‘apparent steel supply,’ we calculated this measure by adding domestic steel mill shipments to finished US steel imports and subtracting total US steel exports.
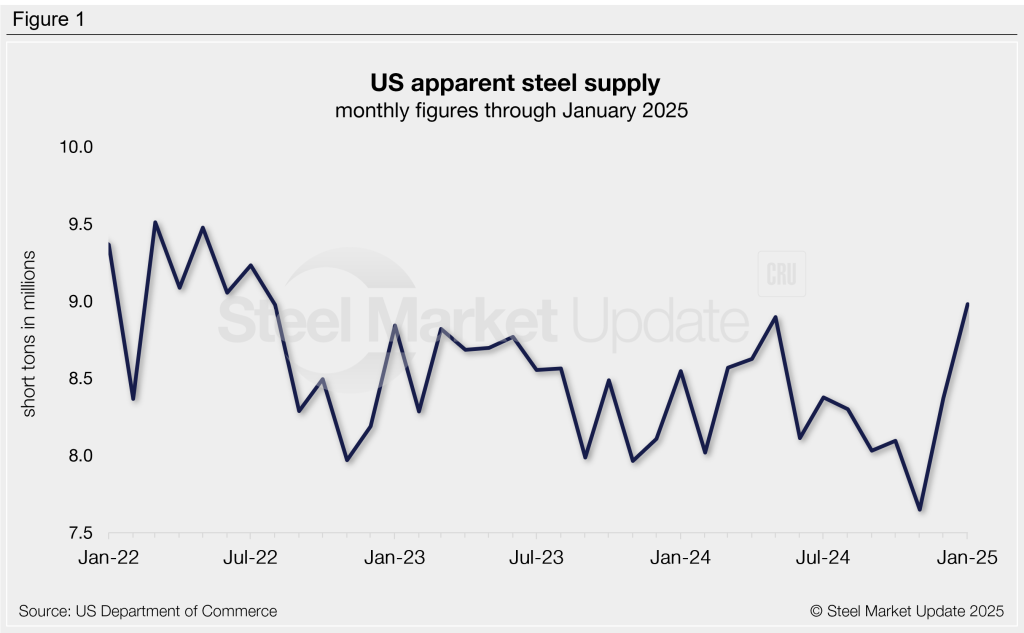
Previously at a five-month high, total apparent supply rose to 8.98 million short tons (st) in January, a monthly increase of 609,000 st, or 7%. This comes just two months after supply dropped to a near four-year low of 7.65 million st last November. January supply was 5% higher than levels recorded this time last year.
Since mid-2022, supply has generally remained within the 8-9 million st range each month. For context, the highest monthly supply rate in our 15-year data history was 10.90 million st in October 2014, while the lowest was 6.52 million st in April 2020.
Trends
To smooth out monthly fluctuations and better highlight trends, monthly supply levels can be calculated on a three-month moving average (3MMA), as shown in Figure 2.
Supply on a 3MMA basis has generally trended lower following the late 2021 peak of 9.87 million st. The 3MMA increased to 8.33 million st through January. This follows the near-four-year low of 7.93 million st 3MMA reached in November. One year ago, the 3MMA was 8.21 million st, and two years ago it was 8.36 million st.
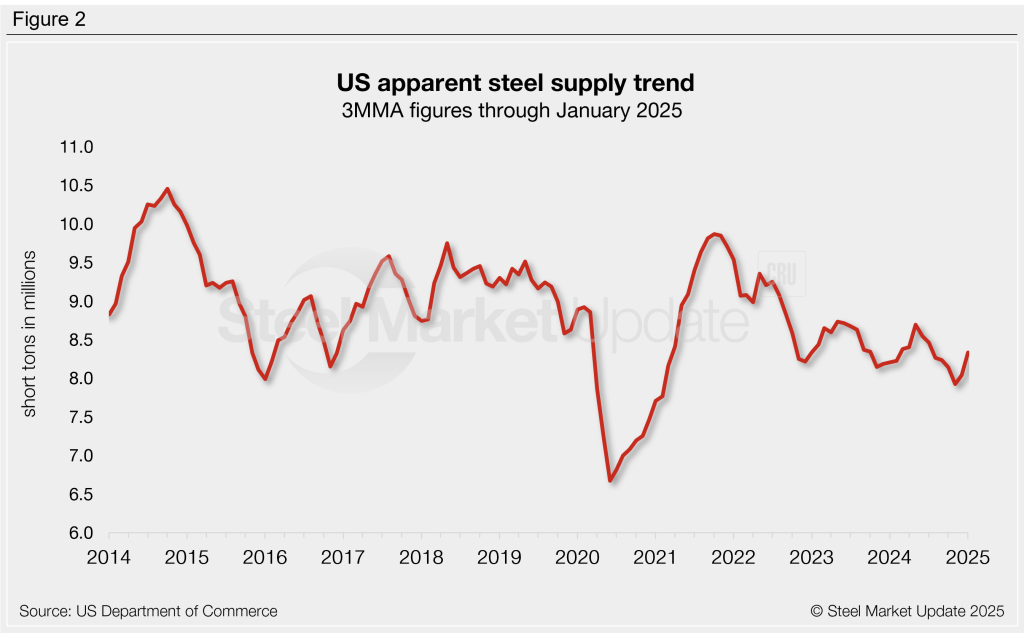
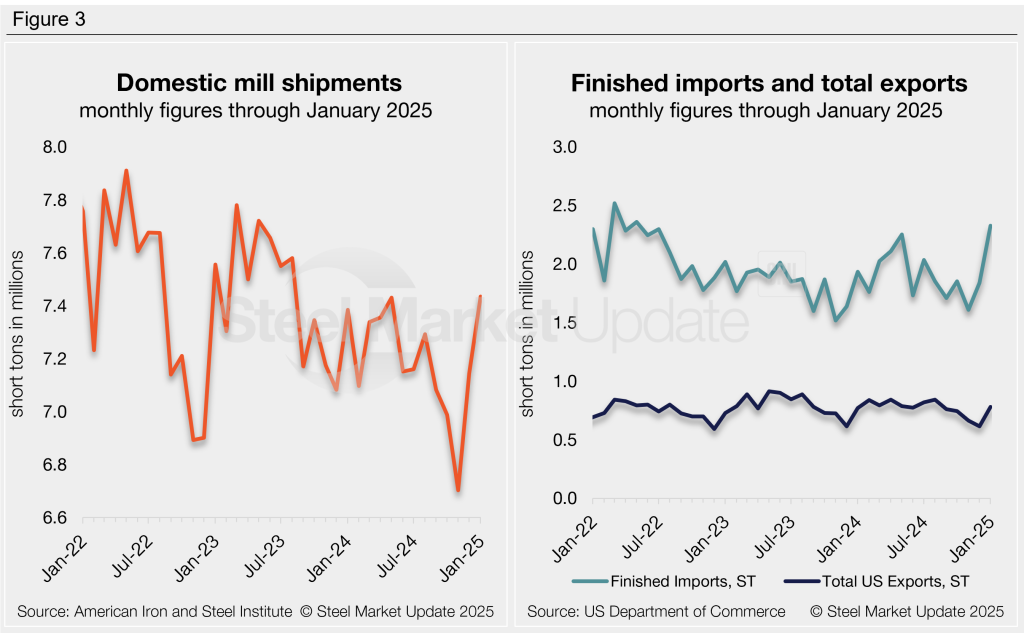
Figure 3 graphs the individual inputs for apparent supply, clearly showing how finished steel imports primarily contributed to January’s increased volume.
- Finished steel imports jumped in January by 486,000 st, or 26%, month over month (m/m), the highest rate in nearly three years. Finished imports accounted for 26% of January’s total supply.
- Domestic mill shipments rose by 290,000 st (4%) m/m to a 17-month high, accounting for 83% of supply.
- Exports increased to a five-month high in January, rising 168,000 st, or 27%, m/m, and partially offsetting the overall increase in supply. Exports accounted for 9% of supply in January.
To see an interactive graphic of our apparent steel supply history, click here. If you need any assistance logging into or navigating the website, contact us at info@steelmarketupdate.com.