Analysis
April 22, 2025
Fed indicators signal healthy manufacturing sector
Written by Brett Linton
Recent Federal Reserve data paints a positive picture of the US manufacturing sector. Manufacturing indicators remained strong through February and March figures. Industrial production, capacity utilization, durable goods, and factory orders are all nearing record-high levels. New orders for iron and steel products held steady, while inventories continued their gradual decline.
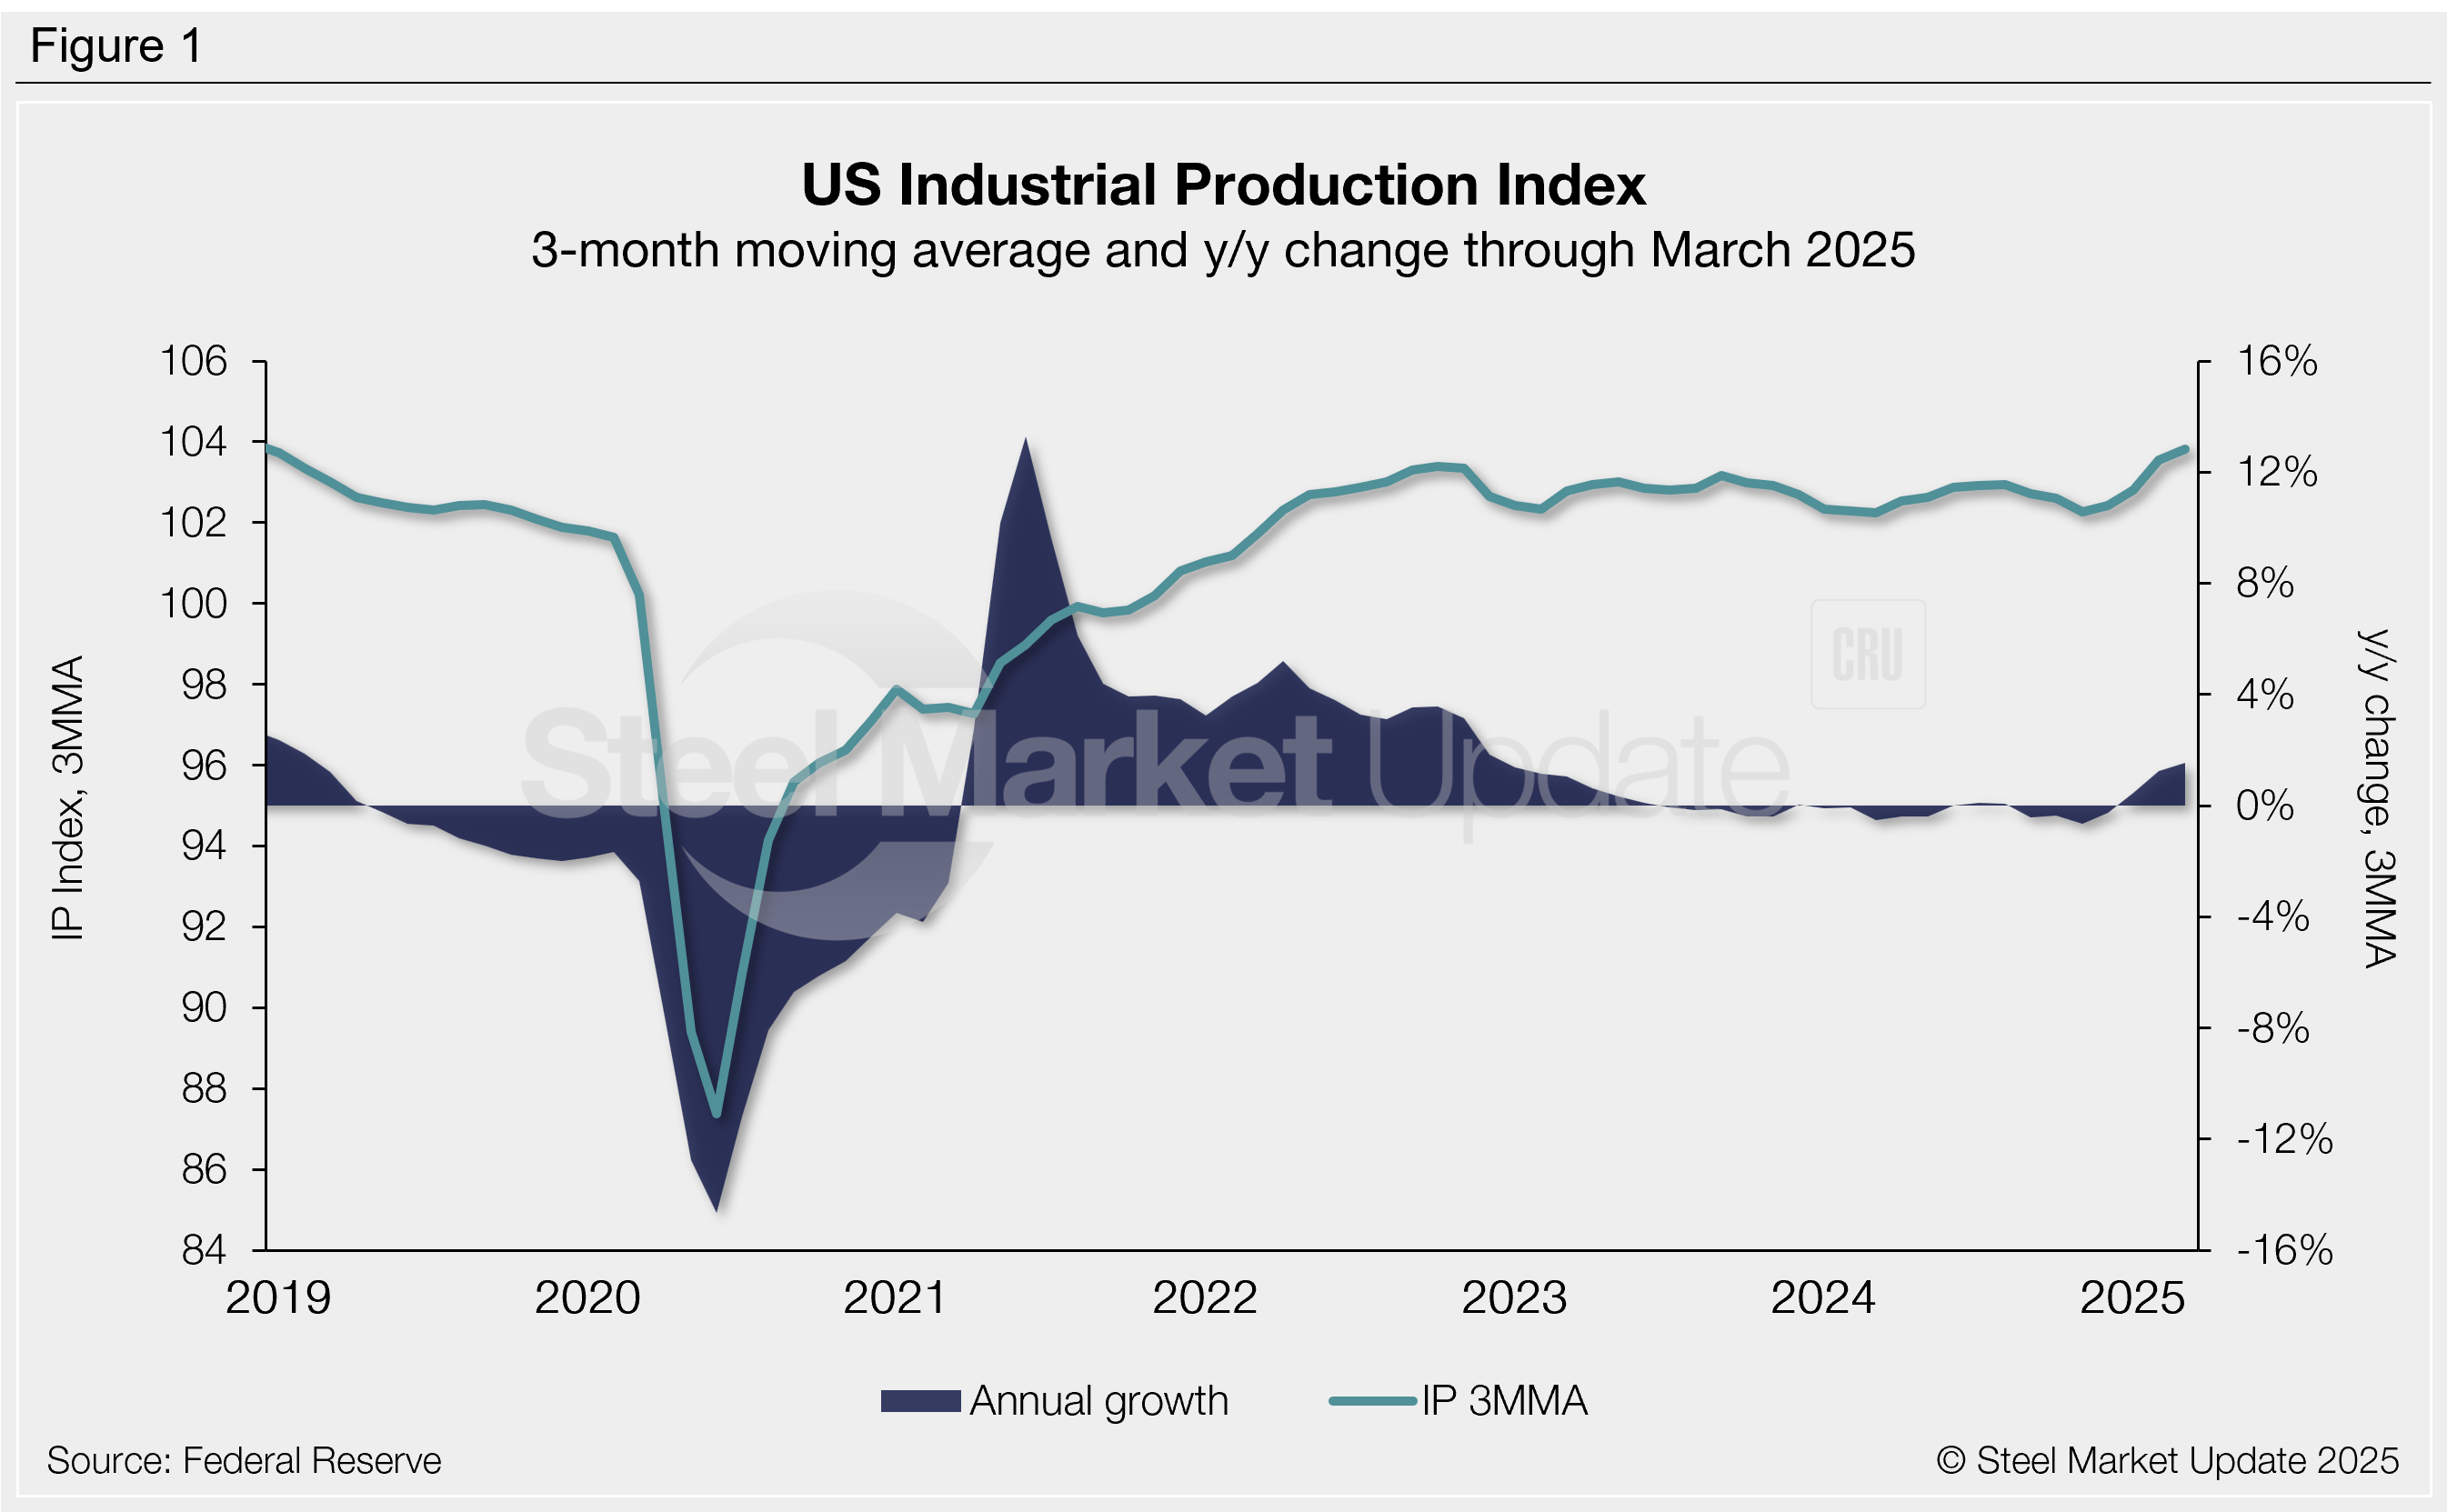
Industrial Production
The Industrial Production (IP) index measures output from factories, mines, and utilities. The index is presented as a three-month moving average (3MMA) in Figure 1 to smooth monthly volatility. Through March the IP index stood at 102.8, strong territory it has been in for over three years. This is just shy of the record-high rate of 104.1 seen in October 2018, the highest level in our 32-year data history. The IP index has posted positive annual growth each of the last three months, now the highest rate seen in over two years (1.5%).
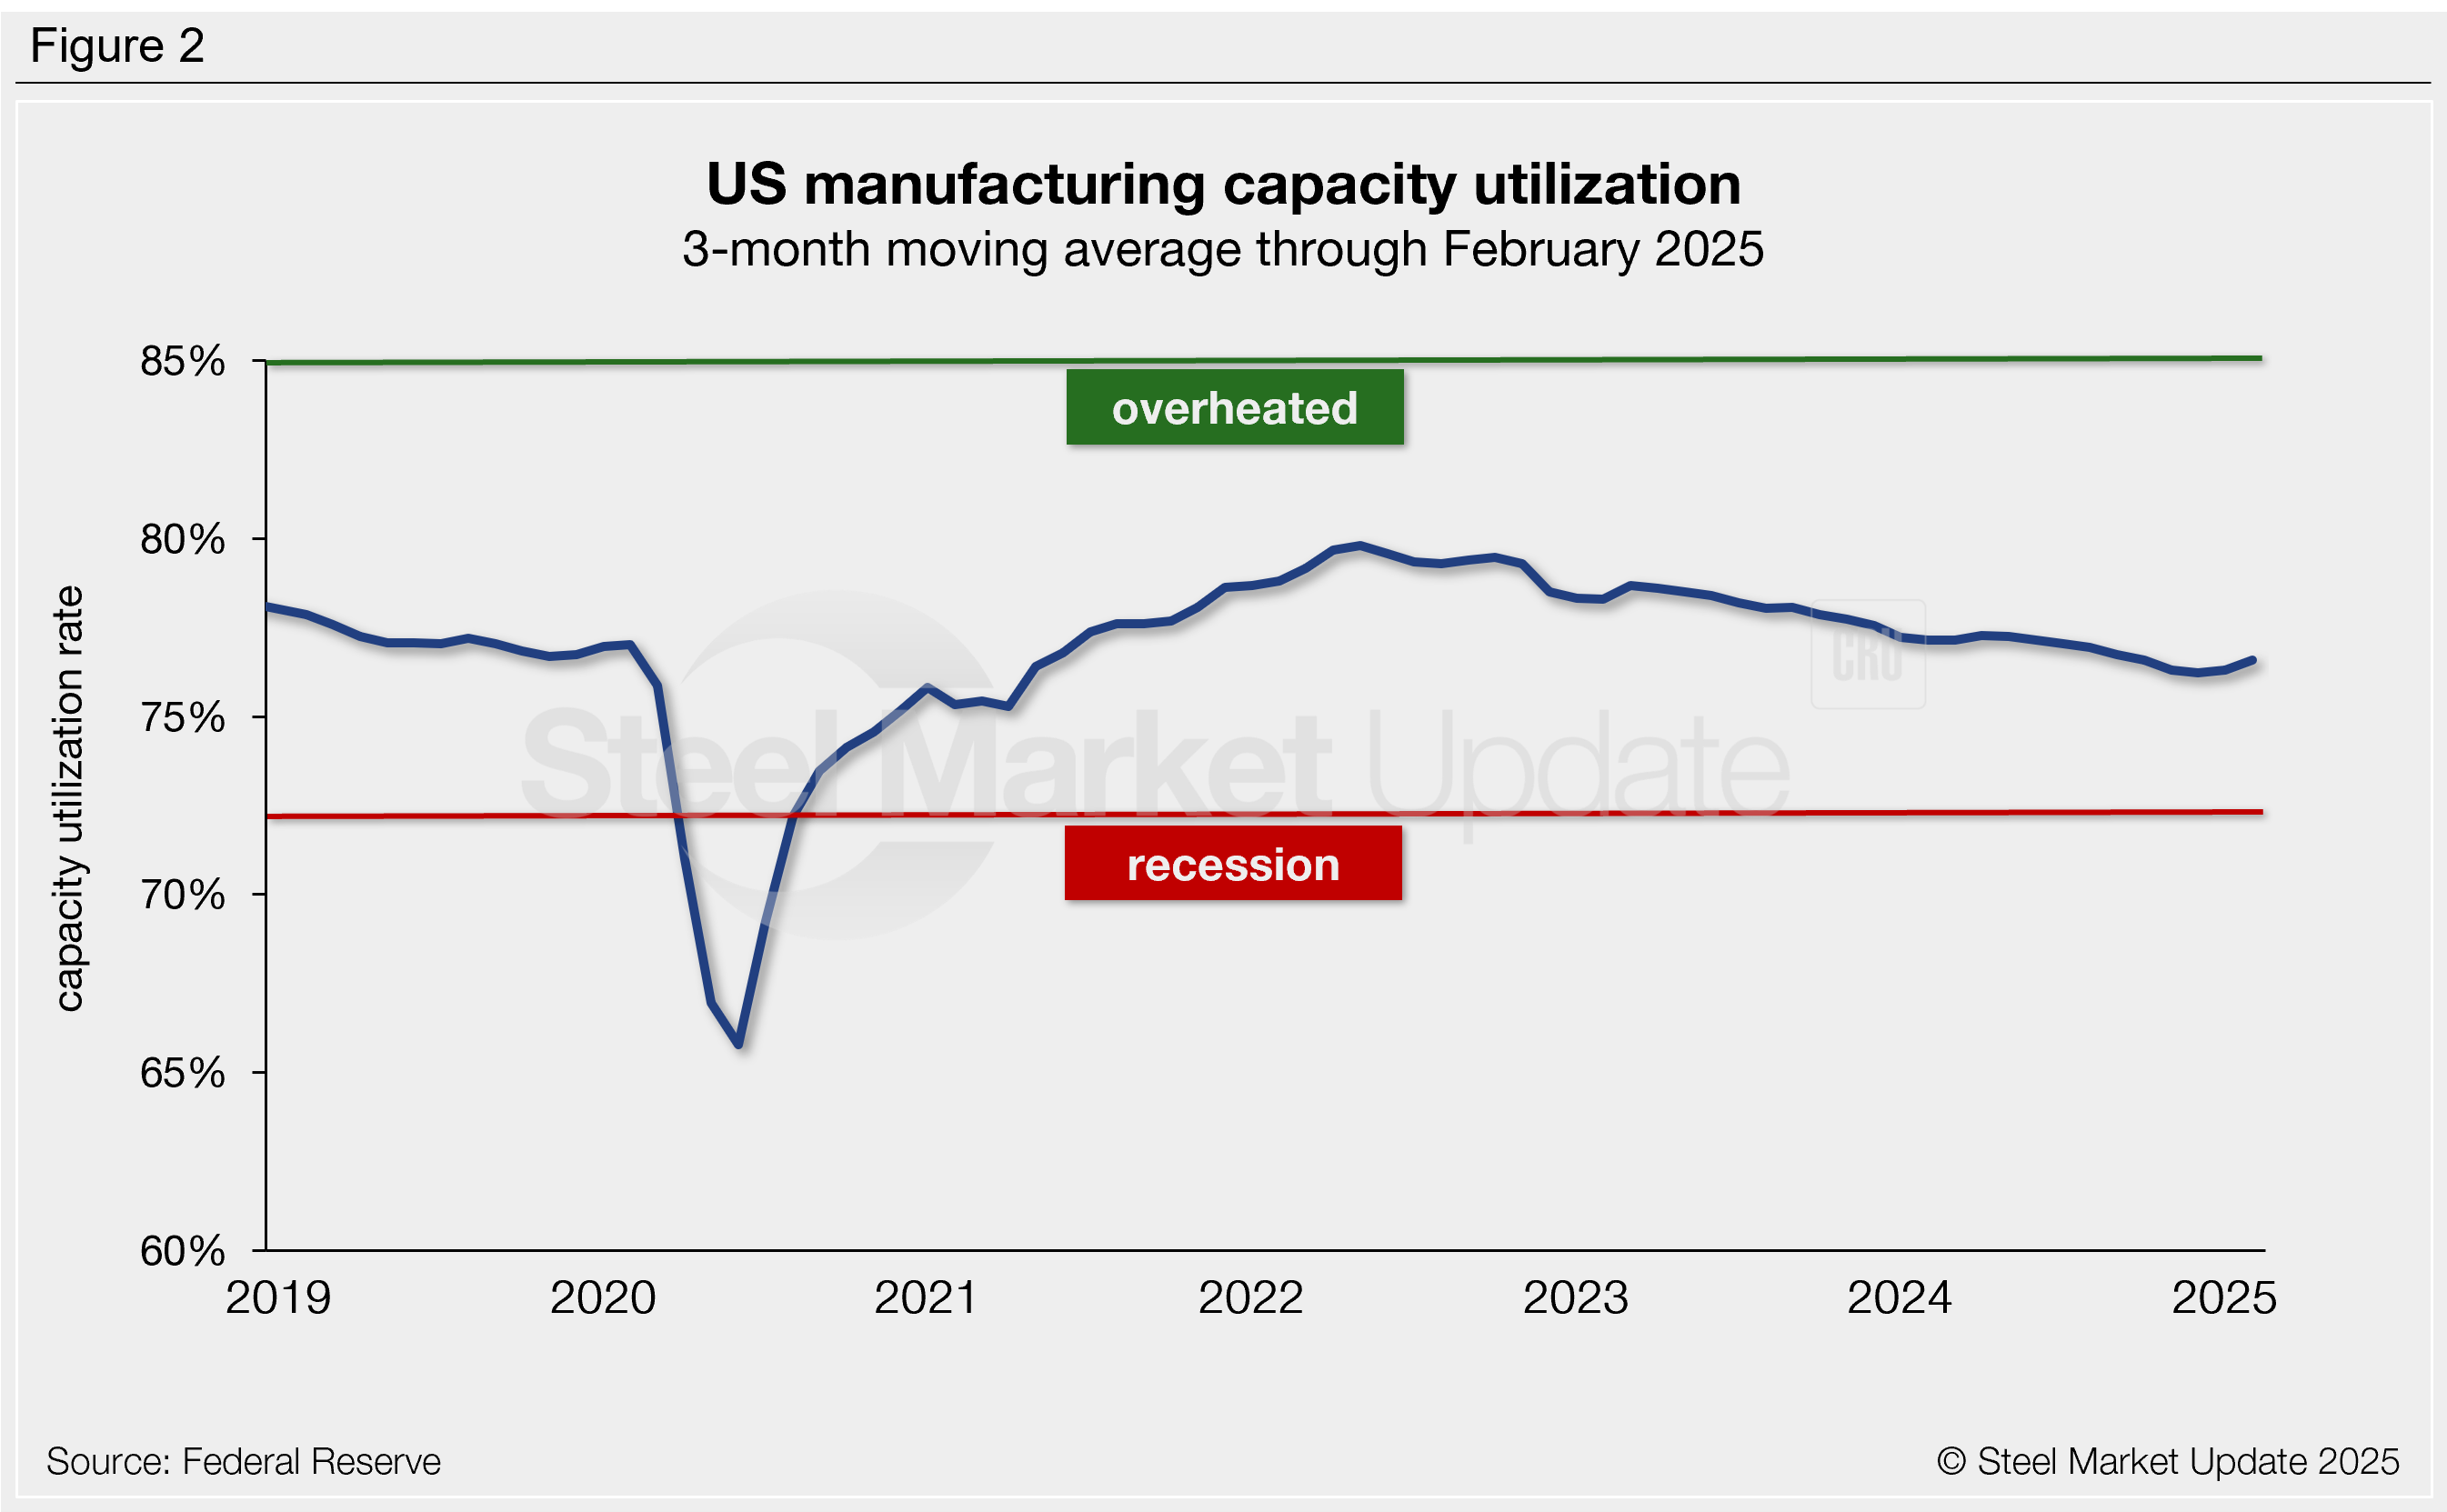
Manufacturing capacity utilization
Manufacturing capacity utilization had been trending lower from mid-2022 through late 2024, though it remained healthy and well above recessionary territory. The 3MMA rate has risen each of the past two months, rising to a five-month high of 76.6% through February (Figure 2).
Capacity utilization averaged 76.8% in 2024, slightly below recent years (2023 averaged 78.2%, 2022 79.2%, 2021 77.1%). For historical context, this rate had hovered around 74–78% throughout the 2010s, stalling in early-2020 and dropping to a low of 65.8% in June of that year.
New orders for all durable goods
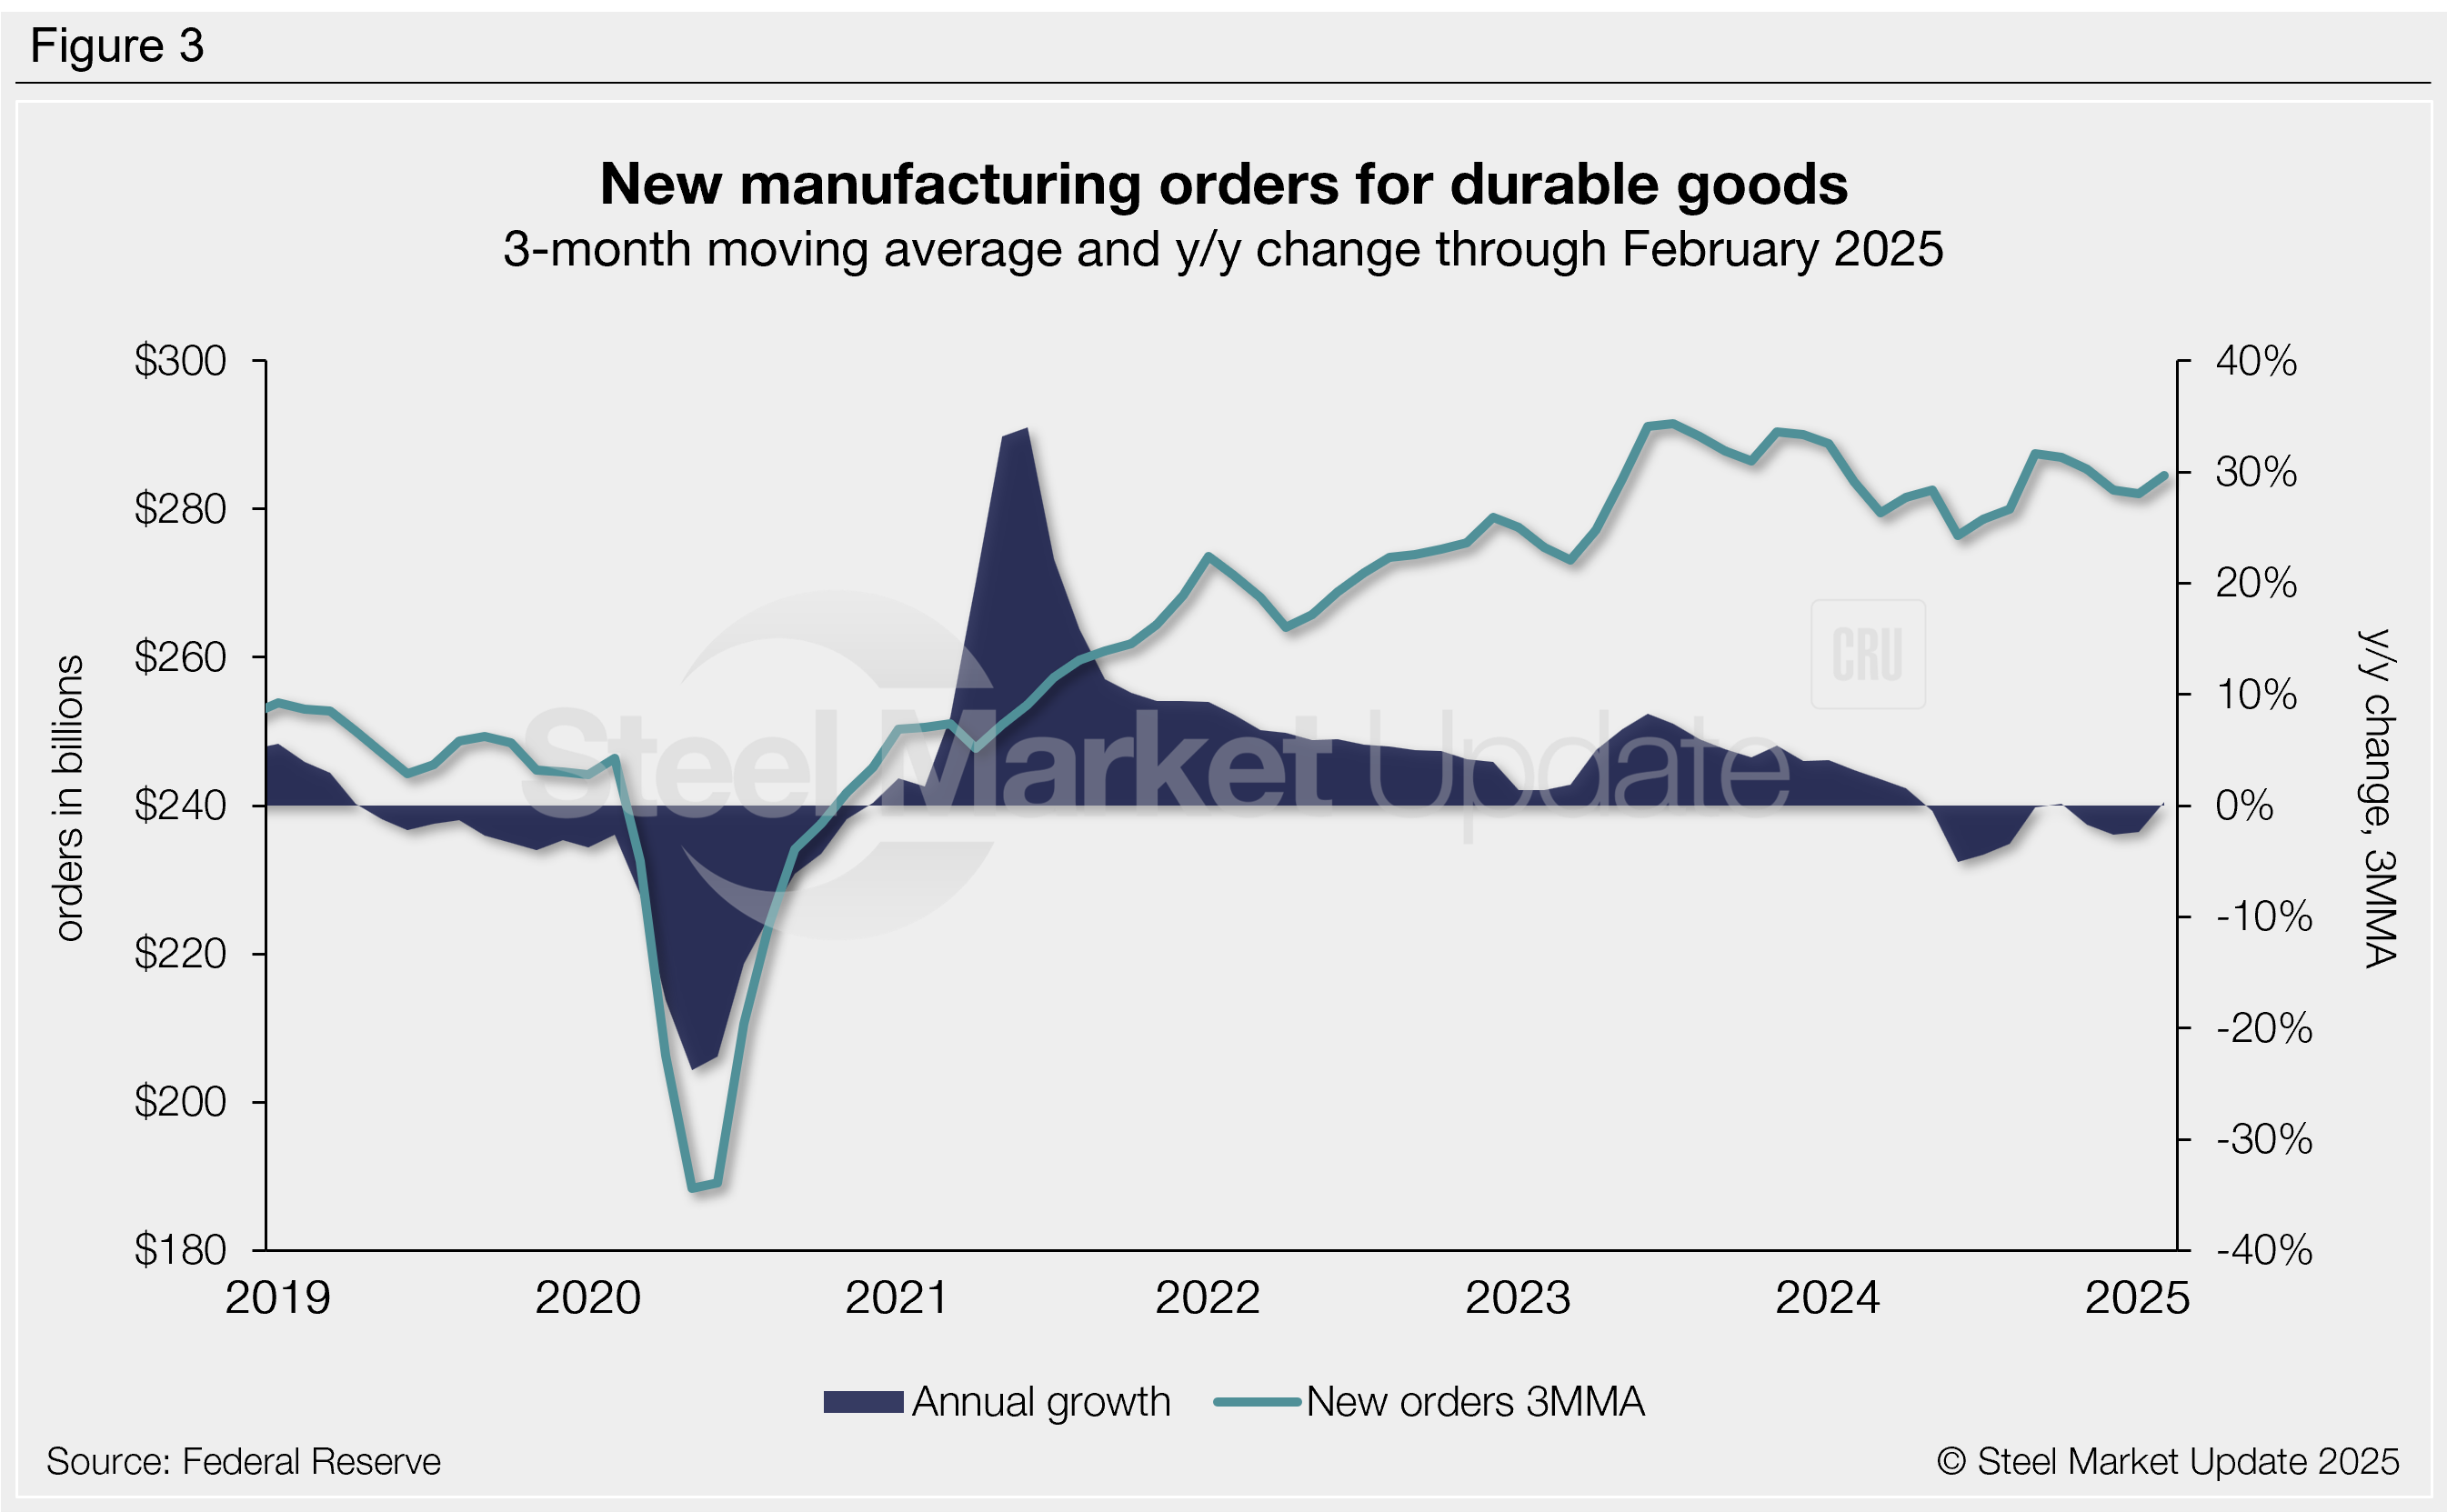
Durable goods new orders are an early indicator of demand for US manufactured goods. This measure continues to recover from the 2020 disruptions, with positive annual growth occurring each month from December 2020 through April 2024.
New orders increased to $284.5 billion as a 3MMA through February (Figure 3), up 0.3% from February 2024. This is one of the higher figures observed in our 33-year data history.
Factory orders for manufactured products
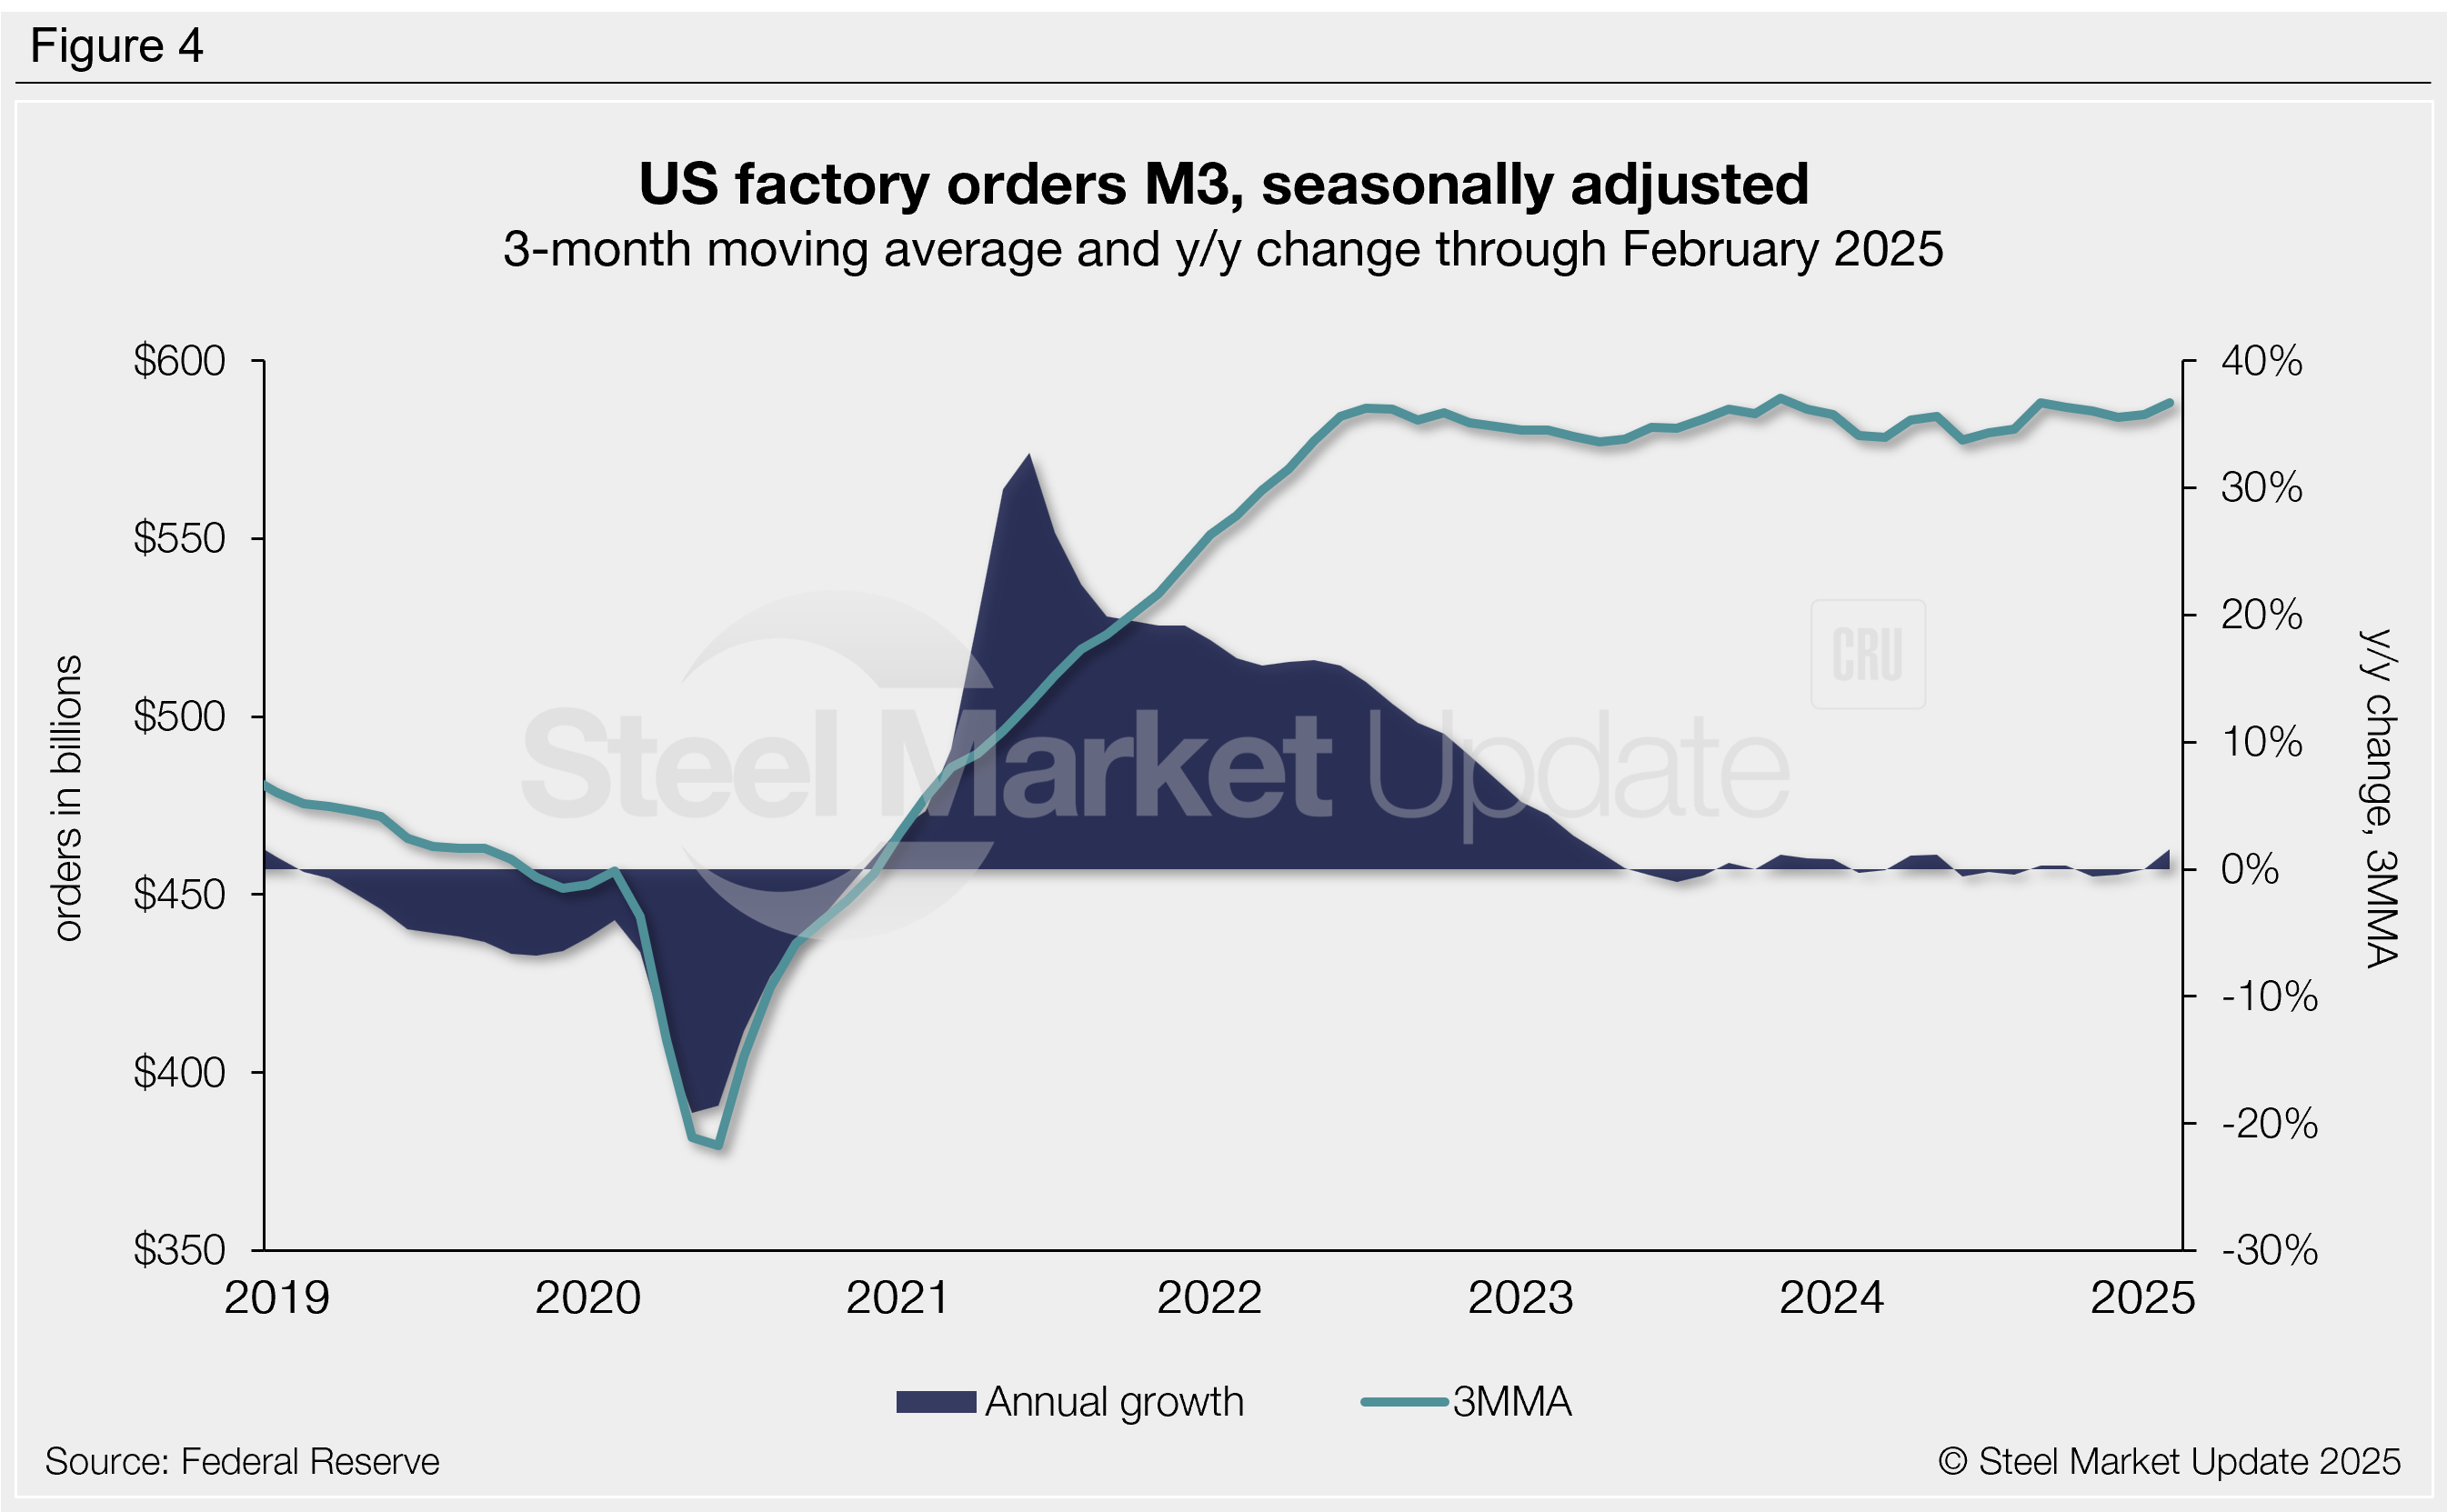
New factory orders for manufactured products remain near historical highs, following the historically strong recovery seen in 2021 and 2022. The annual growth rate of new orders has remained stable since early 2023.
The 3MMA through February inched up to $588.2 billion. This is an increase of 1.6% compared to one year earlier and the second-highest 3MMA witnessed in our 31-year data history (Figure 4).
New orders for iron and steel manufacturing
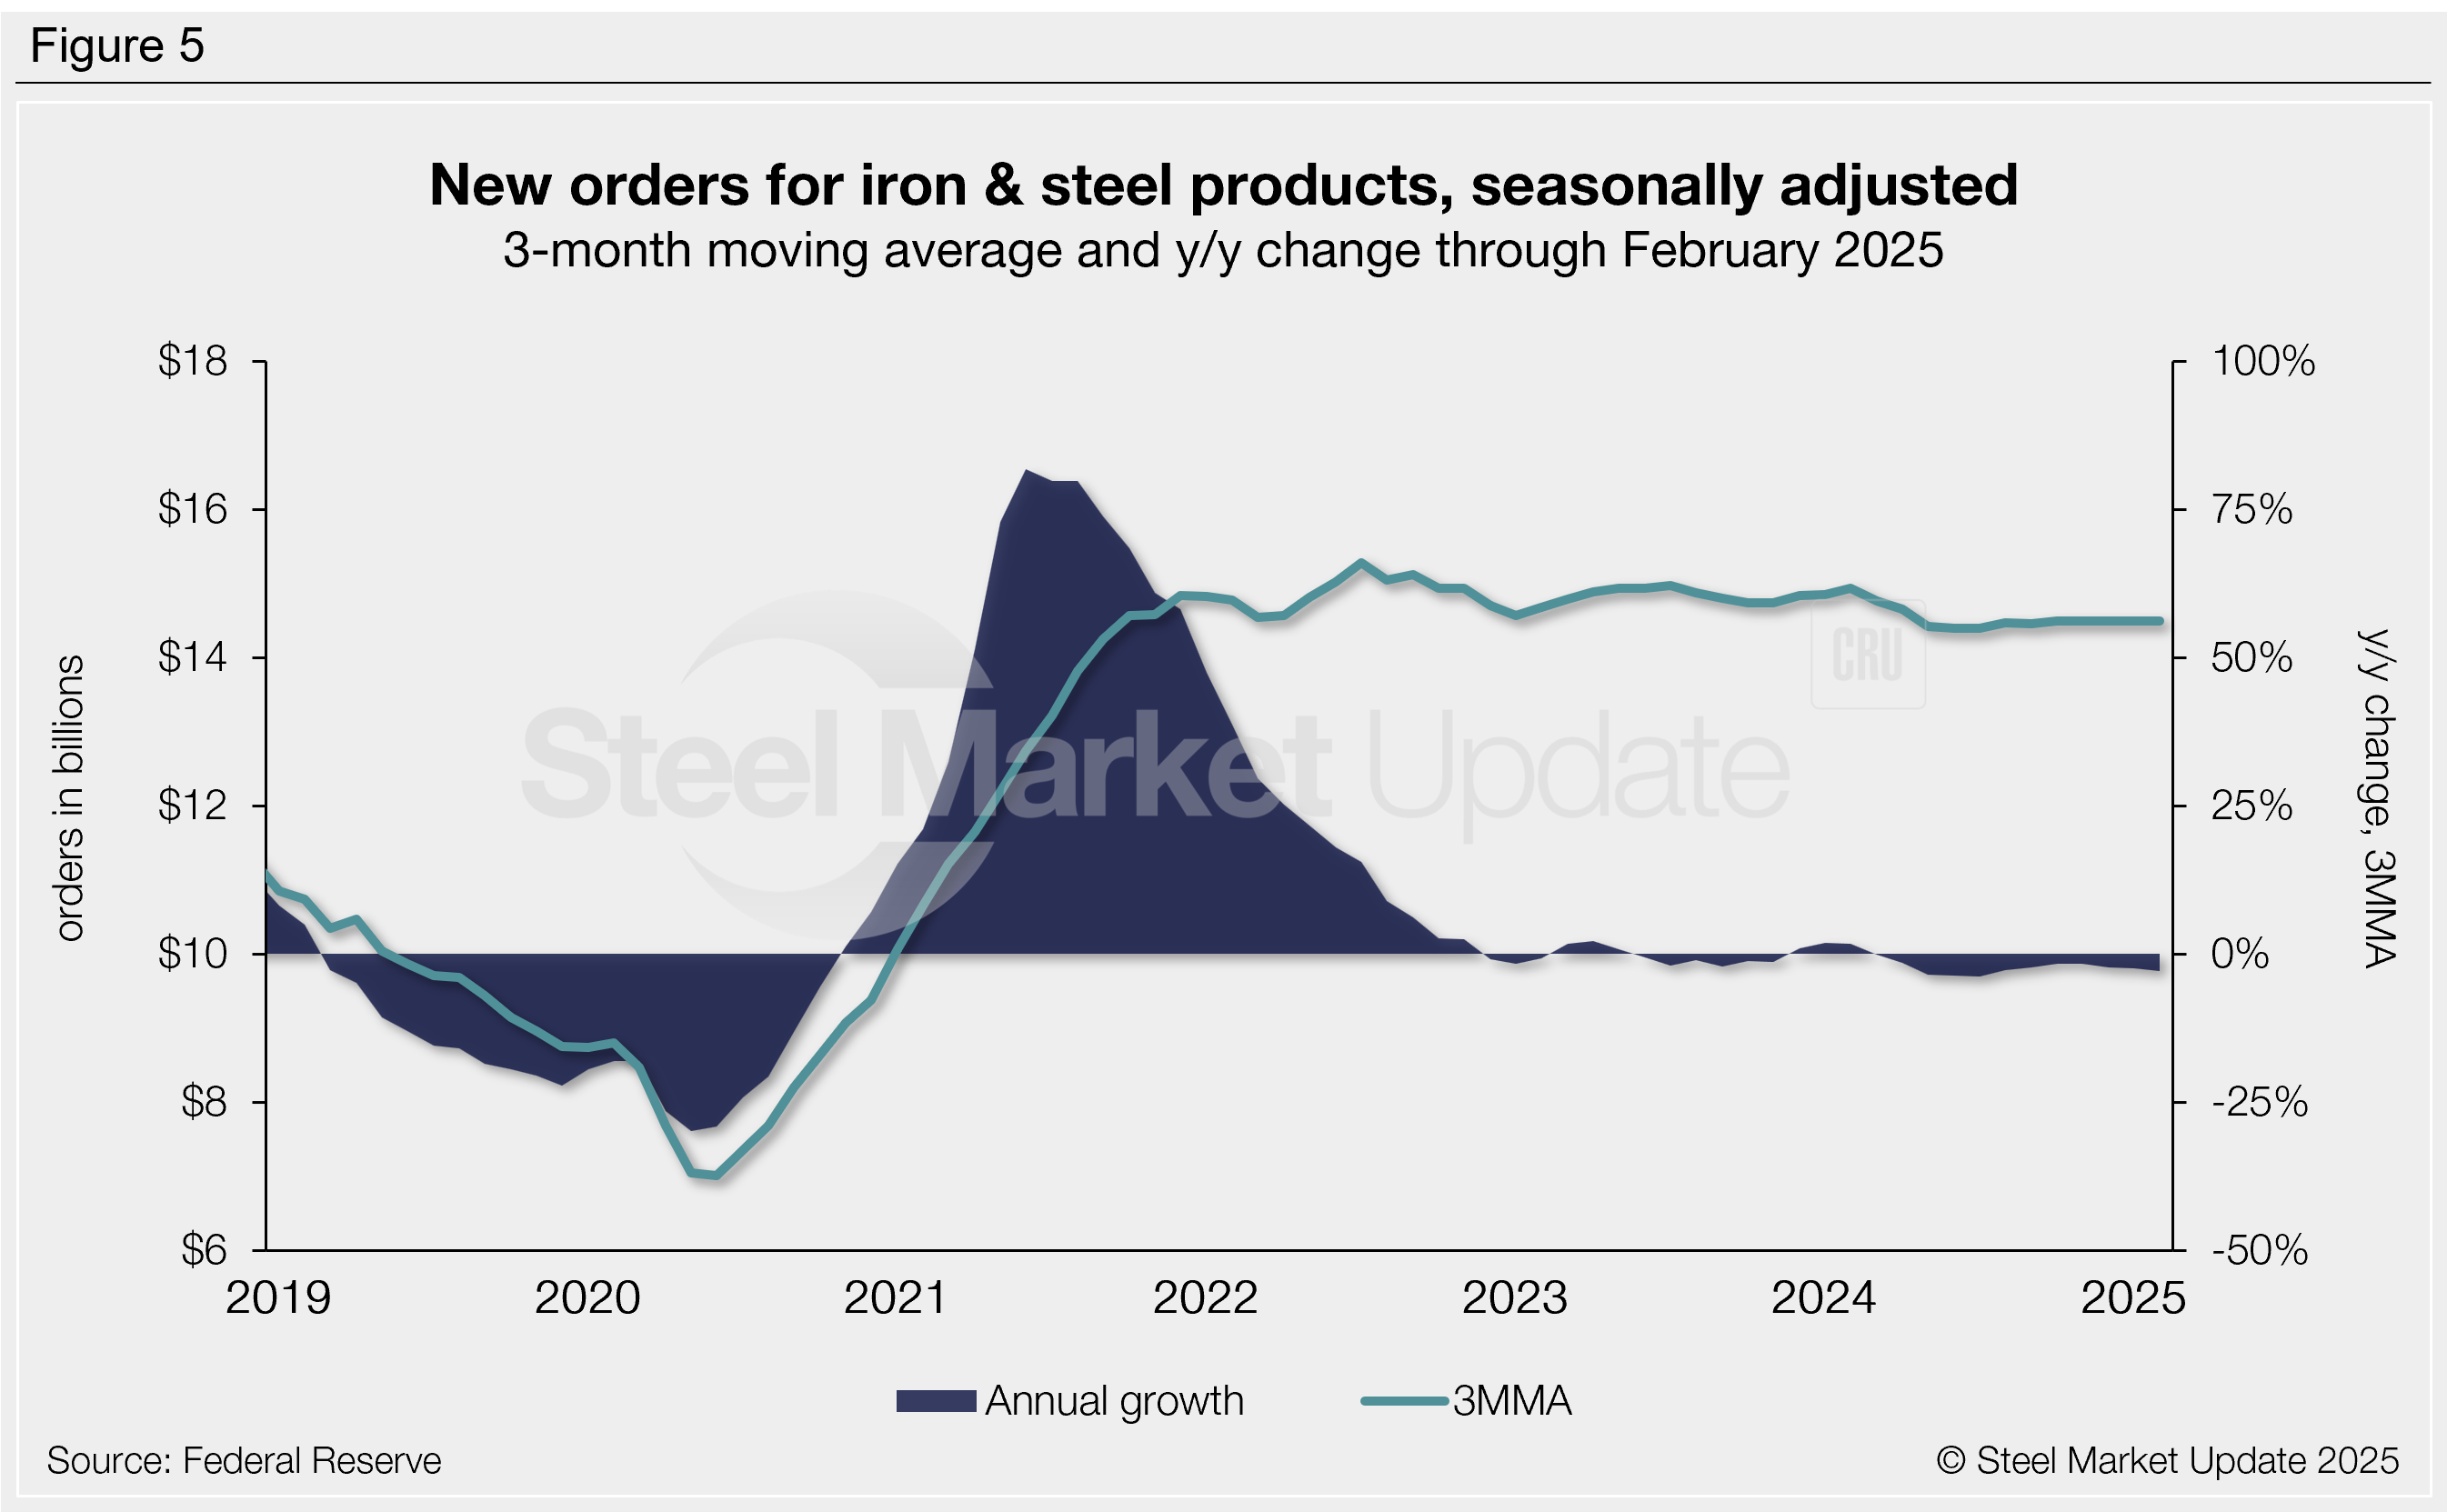
Federal Reserve manufacturing data has a subsection for iron and steel products. Figure 5 shows the value of new orders for iron and steel products as a 3MMA. This measure saw remarkable growth from mid-2020 through 2021, reaching a record high 3MMA of $15.3 billion in July 2022. The 3MMA through February was $14.5 billion, territory it has been in for nearly three years.
Like manufacturing new orders above, the annual growth rate of new iron and steel product orders has been minimal since late 2022, registering -2.9% through February (the 12th consecutive month of negative annual growth). Recall that we saw an 11-year high growth rate of +81.8% in 2021.
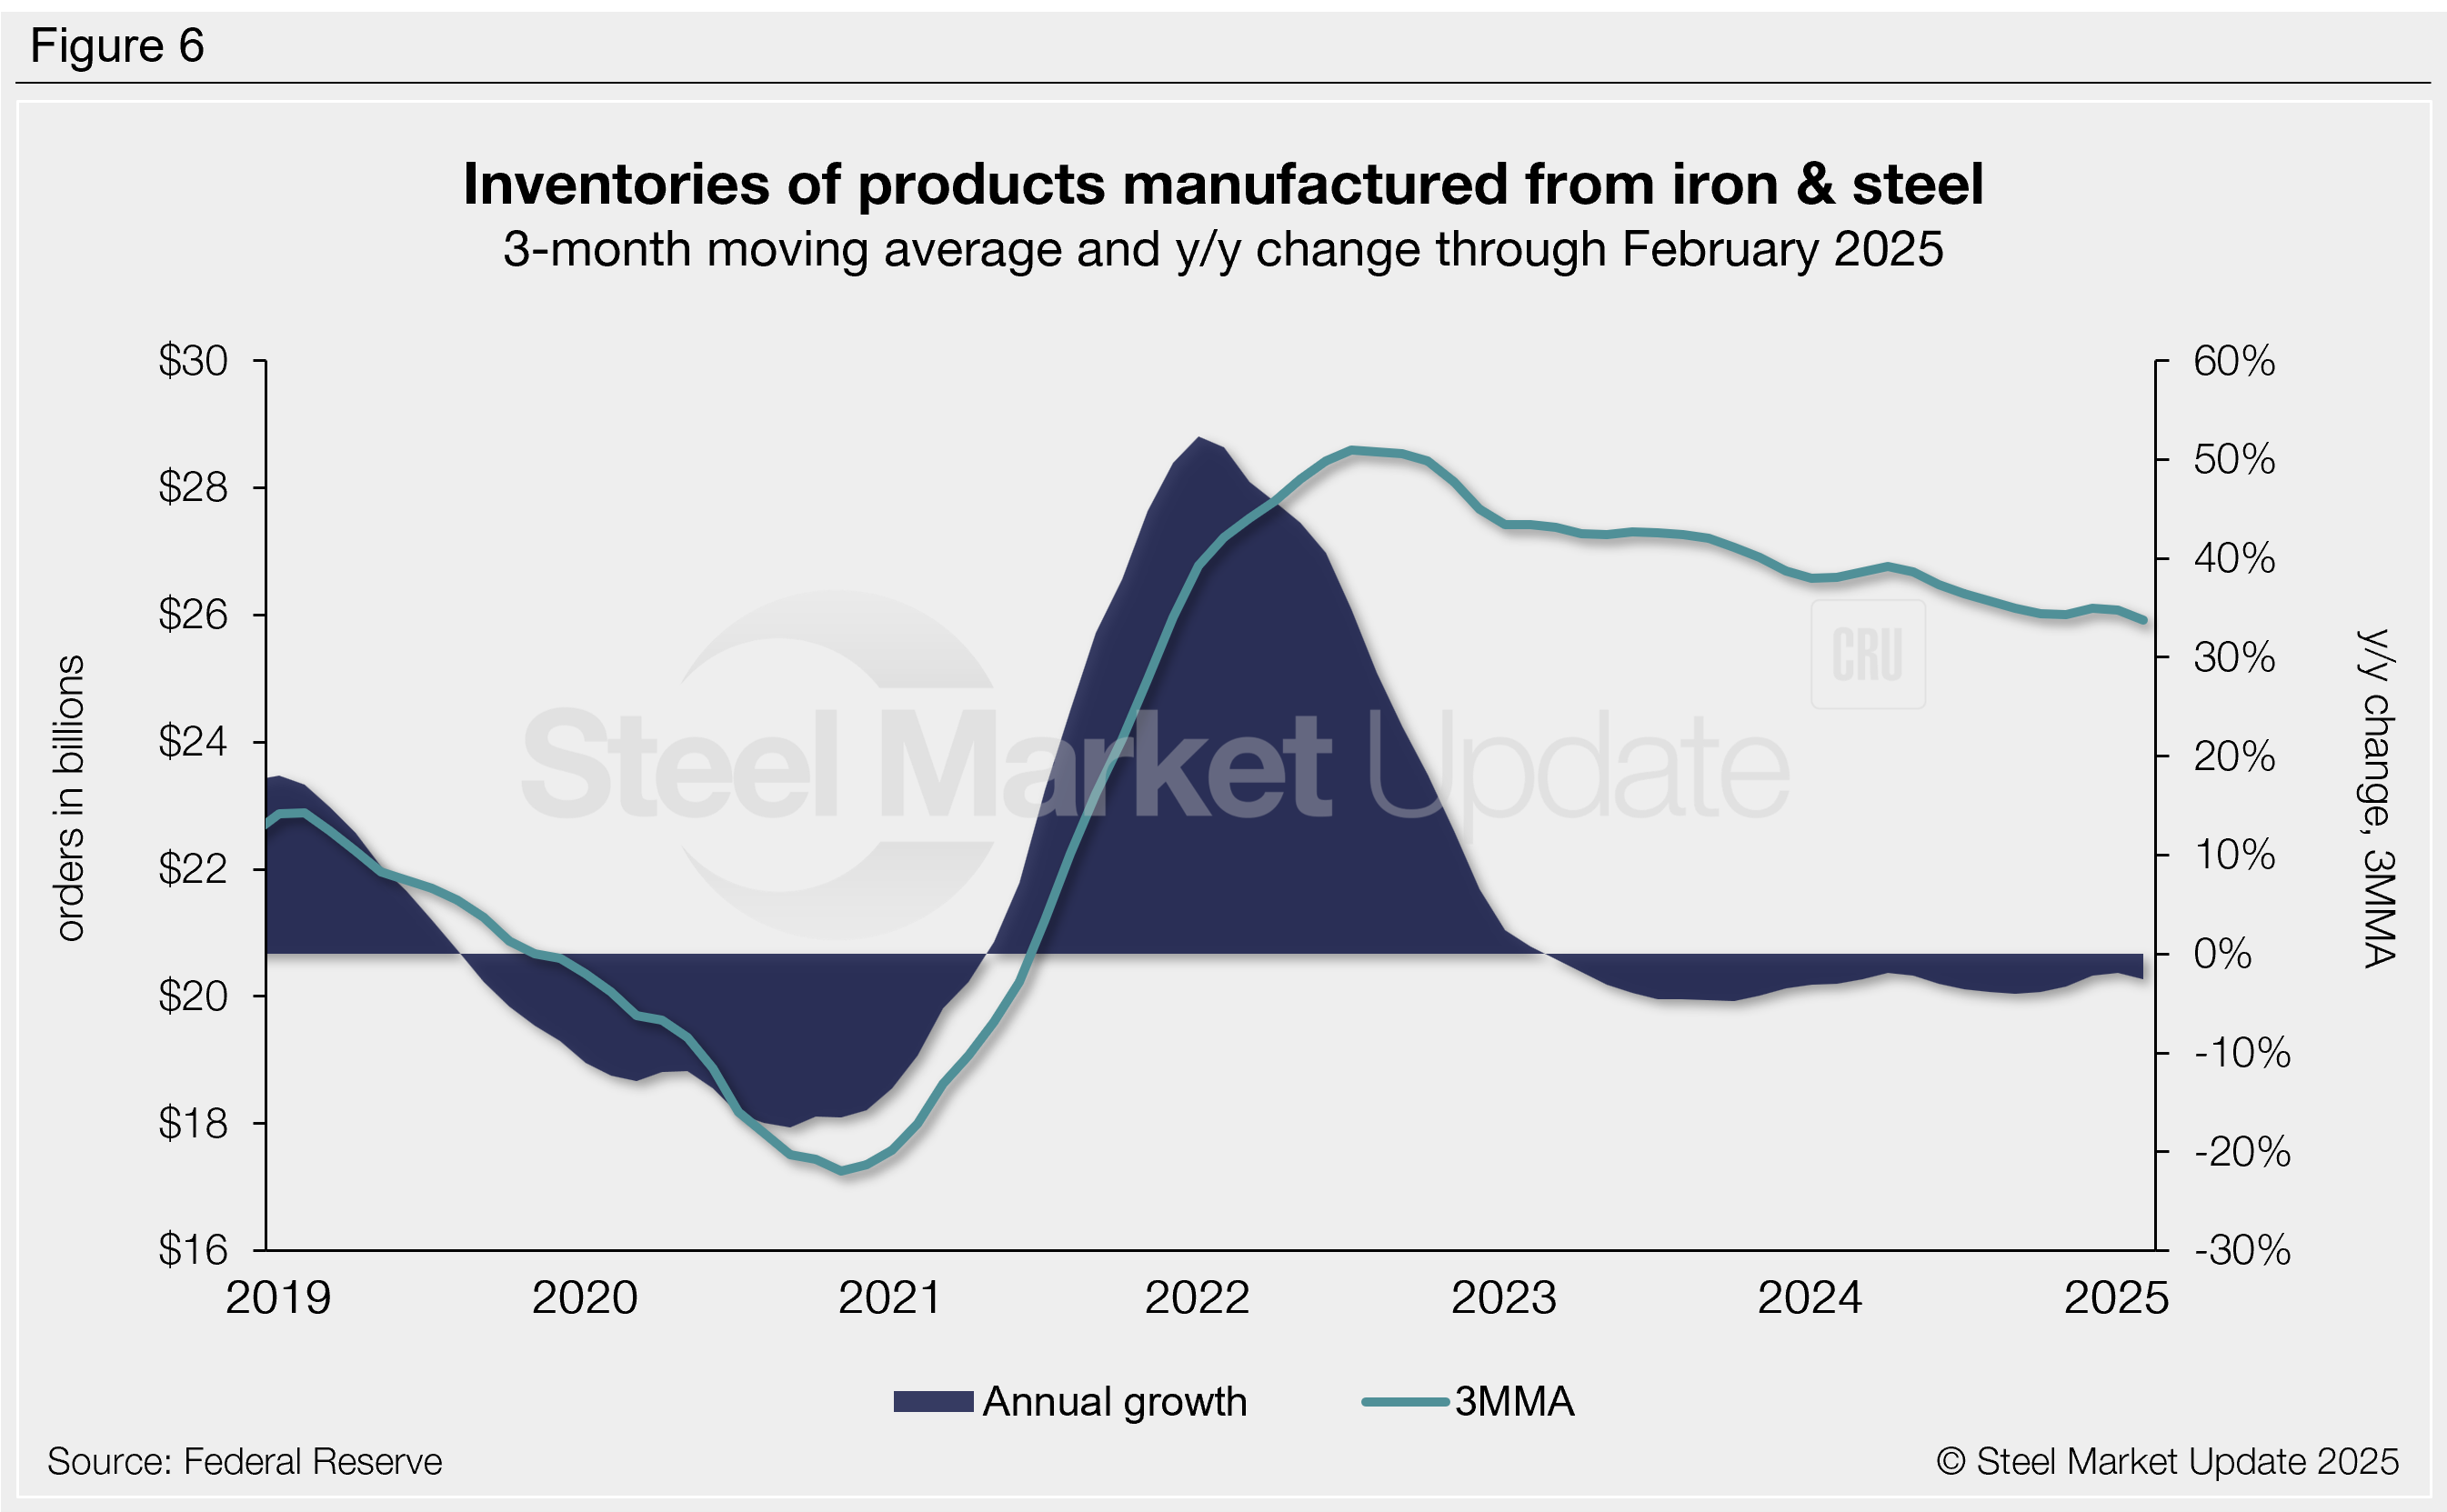
Inventories of products manufactured from iron and steel
Inventories of iron and steel products ended their multi-month increase streak in mid-2022 and have been trending lower since (Figure 6). The latest iron and steel inventory levels totaled $25.9 billion on a 3MMA basis through February. This is down 2.6% compared to the same period one year prior, marking the 24th consecutive month of negative annual growth.