Market Data
May 15, 2025
Service centers: Mill orders down further in April
Written by David Schollaert
Steel Market Update is pleased to share this new, Premium content—an index comparing service centers’ new order entries from steel mills—with Executive members. For information on upgrading to a Premium-level subscription, email info@SteelMarketUpdate.com.
SMU’s Mill Order Index (MOI) declined for a second straight month in April after repeated gains at the start of the year, according to our latest service center inventories data. The slowdown comes as both intake and new order entries edged lower.
And while services centers have worked to right-size inventories, downstream supply might be stocked, pointing to a weaker demand environment.
The MOI now stands at 84.3, down ~14.5% from 98.7 in March and well removed from a six-month high of 114.5 in February. It’s also the lowest reading since October.
A rise in intake volume was reported for most of Q1. This was in response to a boost in buying from downstream customers, pulling forward demand ahead of tariff-fueled price increases. The increase in service center orders was met with a rapid rise in mill prices.
Methodology
SMU’s MOI, which evaluates the latest change in service center mill order entries, is a relative index derived from our monthly service center inventories data. This index is a good indicator of current service center buying patterns, displaying perceived demand and lead times. This is notable given that lead times are typically a leading indicator of steel price moves.
The MOI uses a base period, presently 2022-24, to establish a reference point for measuring service centers’ mill orders over time. This base period is assigned an index value of 100. Subsequent MOI values are then calculated relative to this base.
An index score above 100 indicates an increase in buying, and a score below 100 indicates a decrease.
Figure 1 shows the nearly six-year history of the index on the left and provides a closer look at the MOI readings of the past two years on the right (100 = 2022-24 average).

Background
In the latter half of last year, demand declined gradually, spot purchases slowed, and prices softened.
There were occasional upswings—driven by sudden price increases from mills—but these didn’t last. Buyers were strategic, with service centers making bottom-dollar buys from June through August (as shown in the right-side chart in Figure 1 above) before retreating to focus on inventory control.
The second half of 2024 was marked by disciplined inventory management, as large-volume buyers took advantage of discounted steel prices. However, weak end-market demand remained the dominant theme.
The skinny
While demand remains steady and, in some sectors, is still running a bit hot, the recent tariff-driven buying surge is now long gone. There is a sense that downstream is fully stocked, thus intake and SMU’s MOI should tick lower for the next couple of months.
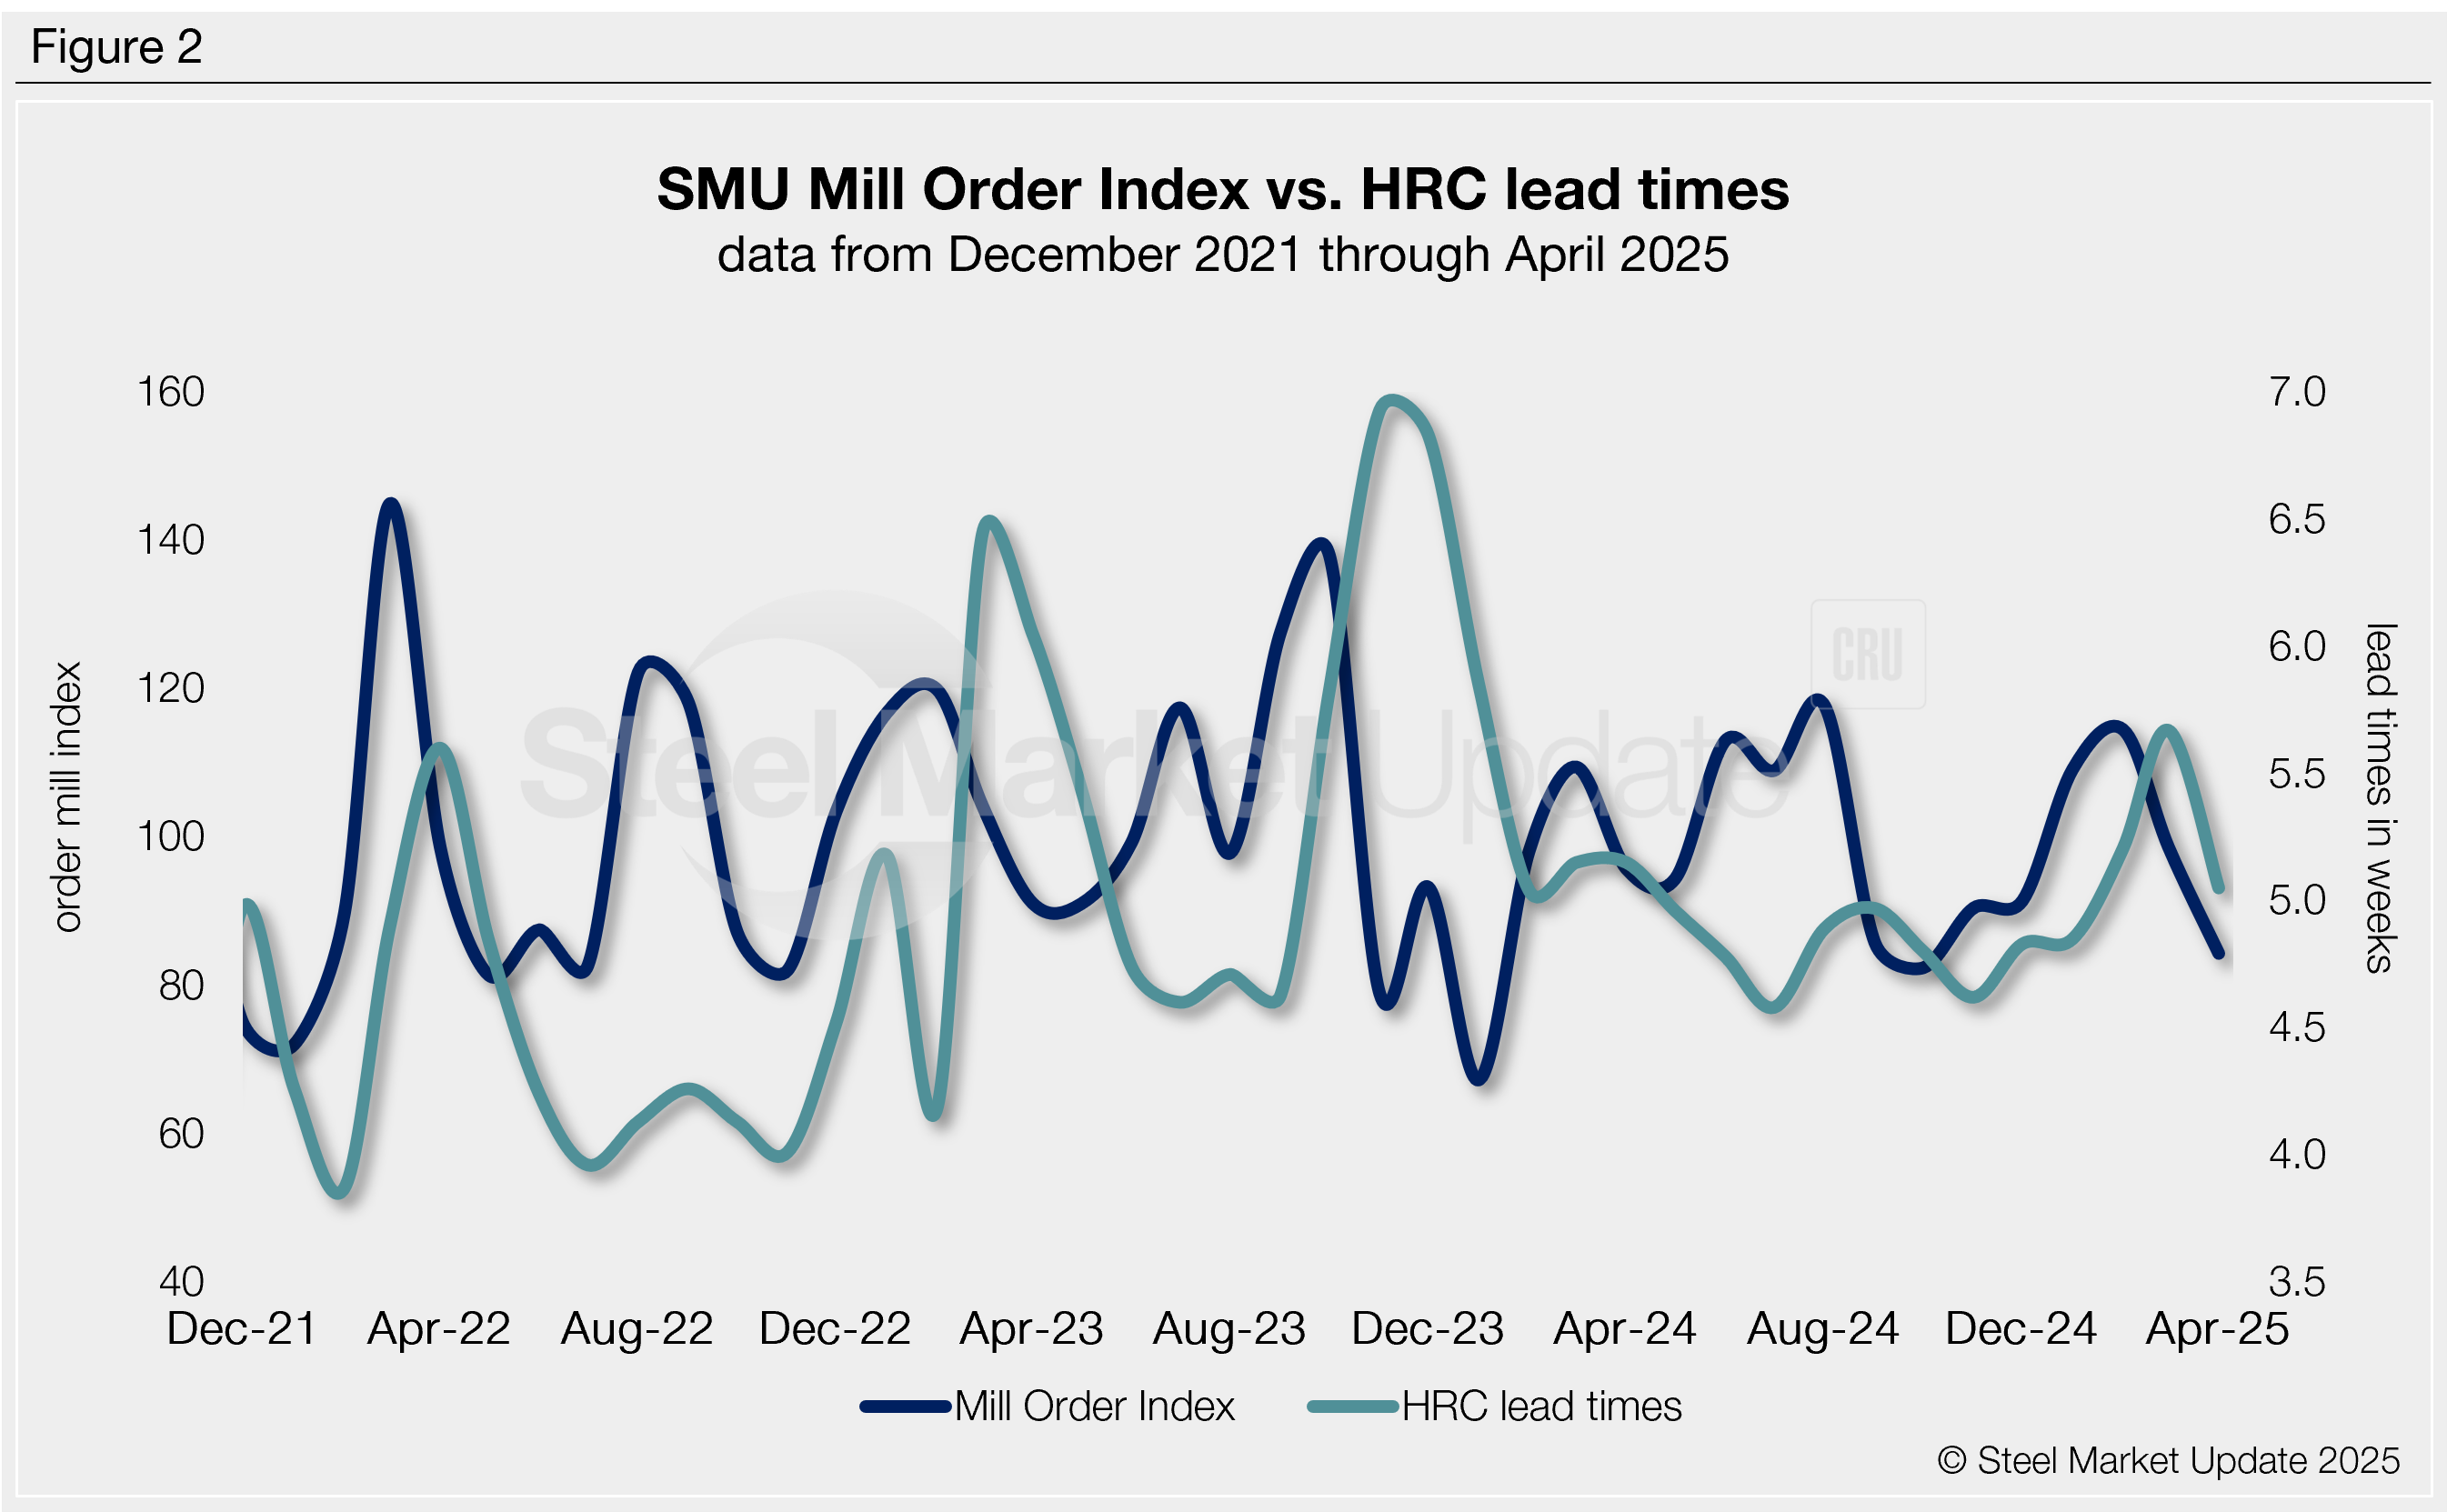
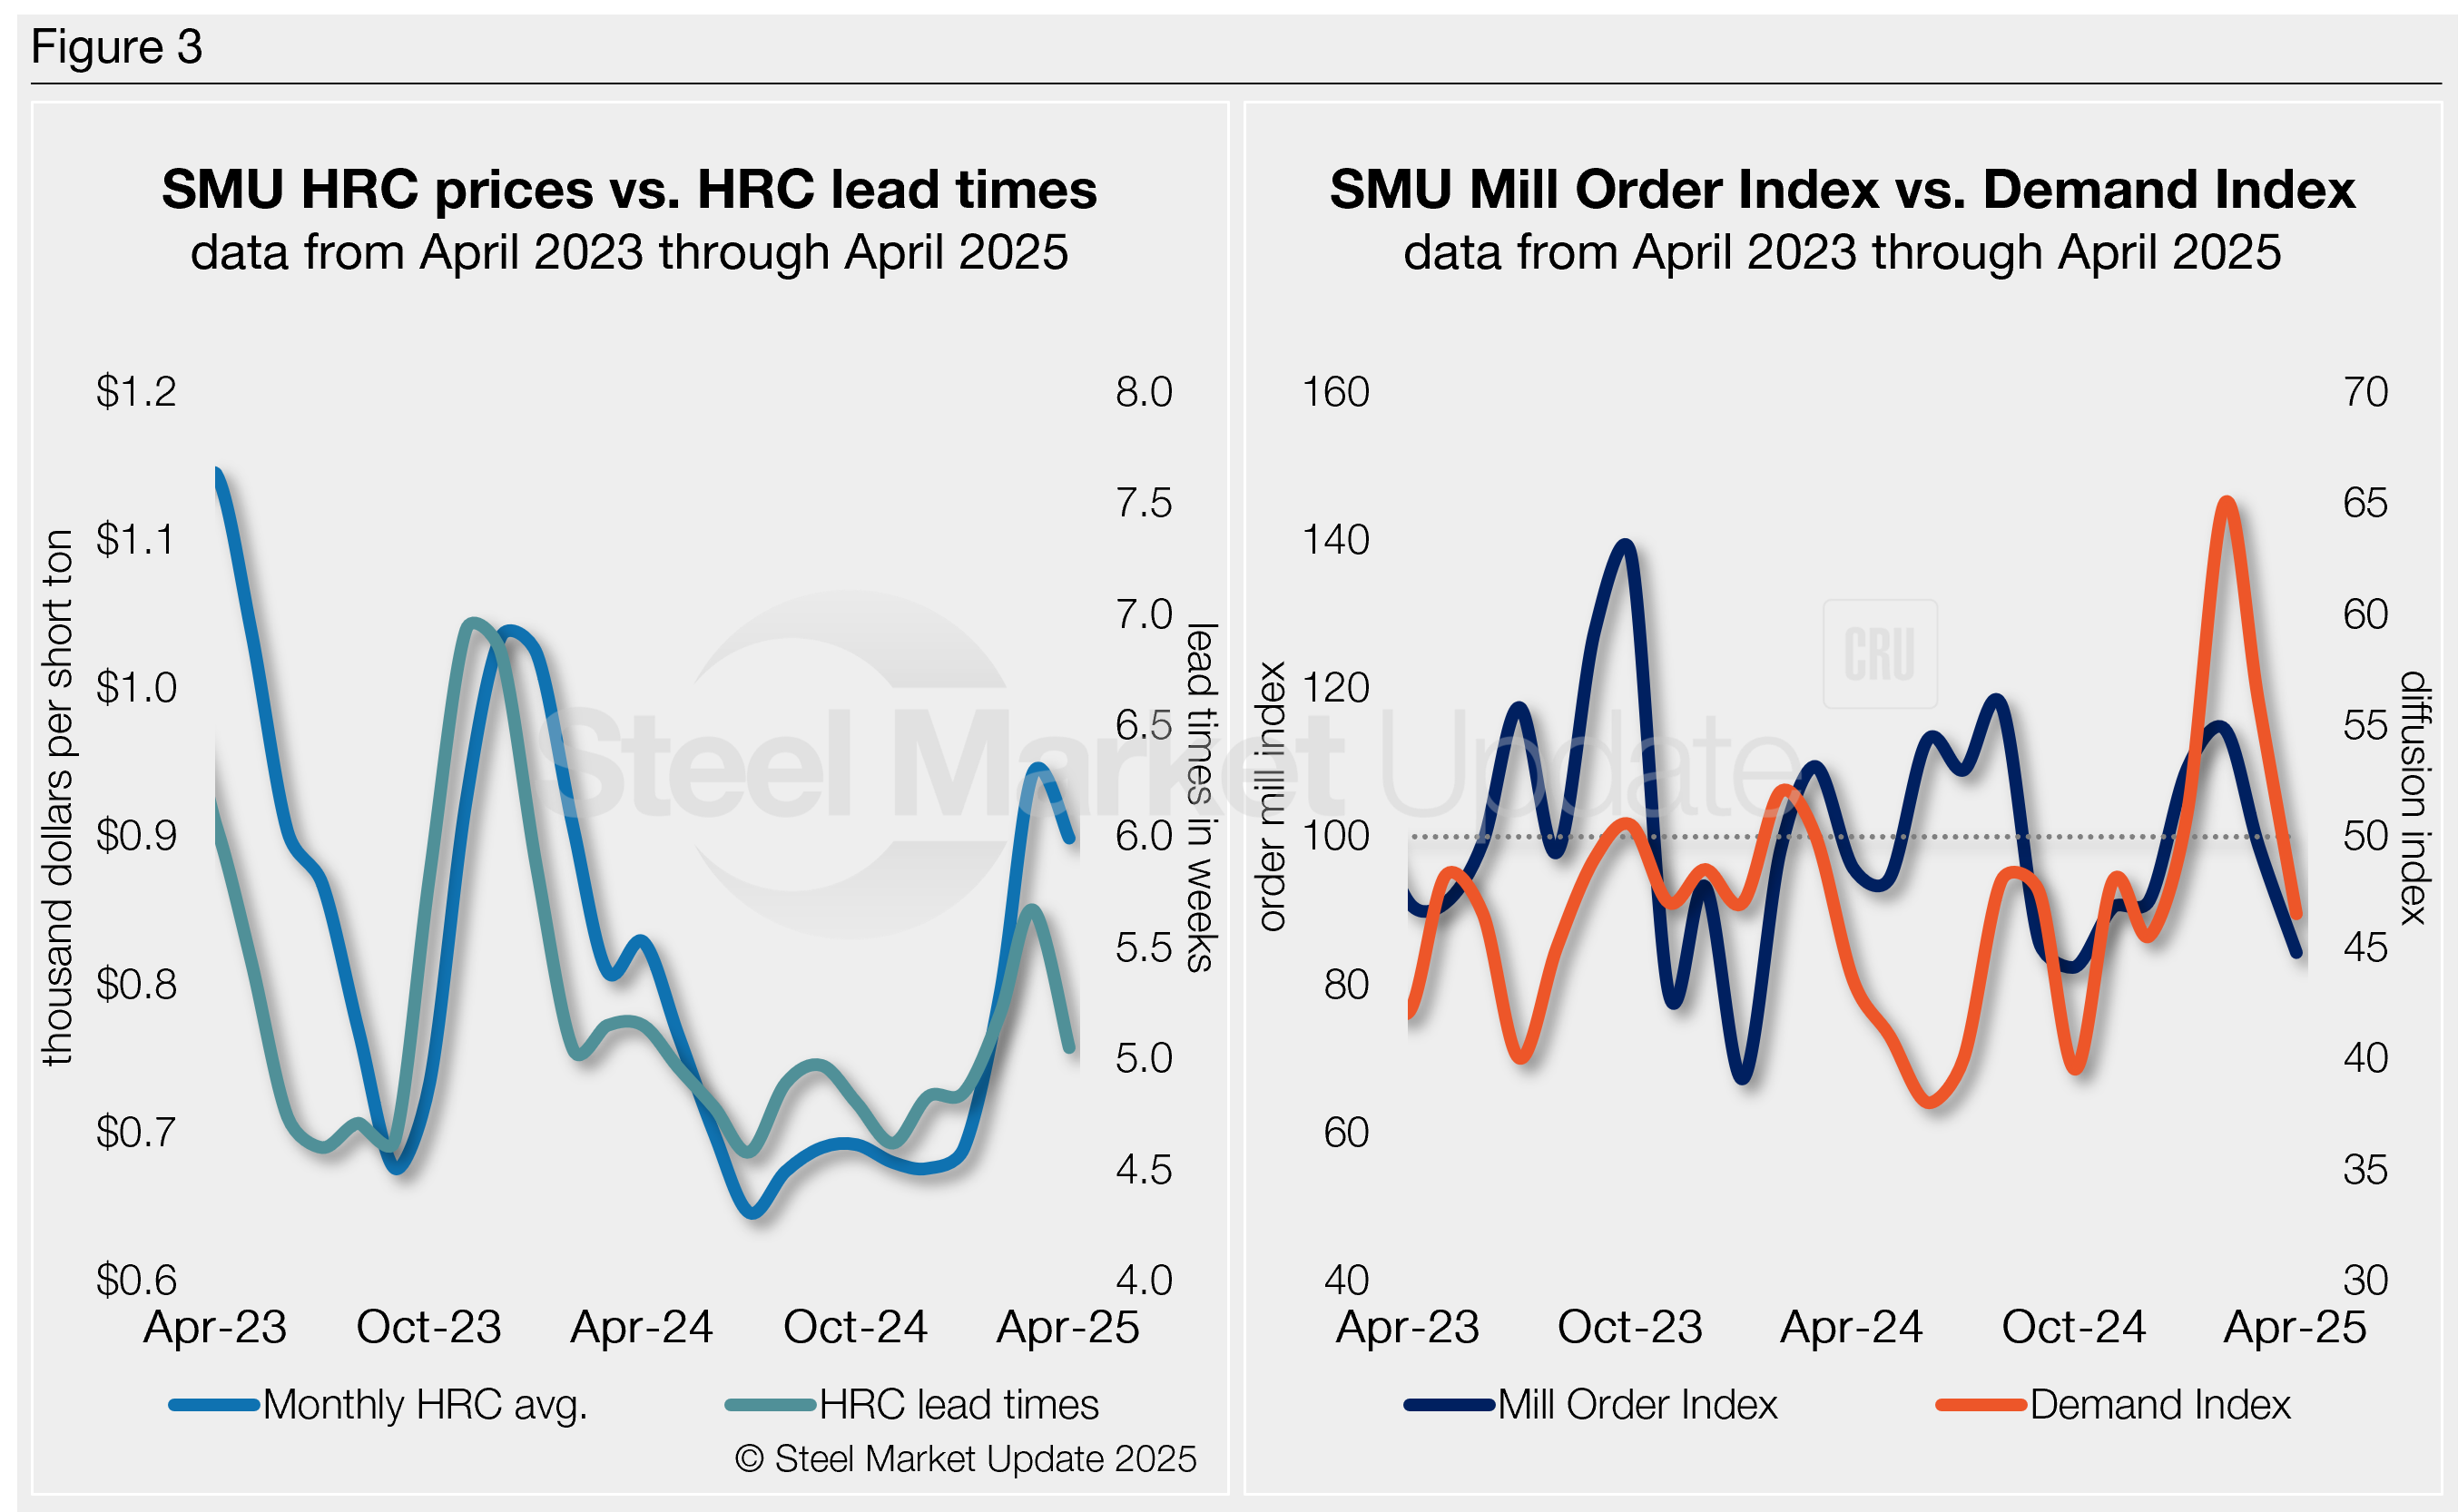
SMU’s MOI pairs well with—and has for the past five years proceeded—moves in mill lead times (Figure 2). And SMU’s lead times have also been a leading indicator of flat-rolled steel prices, particularly for HRC (see left-side chart in Figure 3).
Our MOI also pairs well with our Steel Demand Index (see right-side chart in Figure 3), which, for nearly a decade, has preceded moves in mill lead times.
Prices have turned and are now moving down at a steeper rate. We’ve already started seeing prices edge down—now averaging $845/st, down $30/st week over week (w/w), according to our May 13 check of the market. Prices have not retreated more than $100/st since a recent high of $950/st on average in mid-March.
And lead times were down marginally again in our latest assessment on May 15. They are presently 4.62 weeks on average, down from 5.11 weeks in late April.
Recent survey data suggest the market has peaked for the time being, and now it’s a matter of managing the gap that’s been broadened by Q1 buying that pulled forward demand.
Keep in mind, this is April service center data. All indications already point to a weaker May, and more of the same for June and July. There’s still talk (or call it hope) that the back half of the year will see some improvement.
In the meantime, the latest service center data indicates an increase in inventory days of supply, with material on order—measured in shipping days—also remaining elevated.
Service center shipments will need to improve, but if downstream inventories remain well stocked, a significant shift in demand will be necessary to spur that recovery.
Editor’s Note
Order entries, demand, lead times, and prices are based on the average data from manufacturers and steel service centers who participate in SMU’s monthly inventories and every other week market trends analysis surveys. Our demand and lead times do not predict prices but are leading indicators of overall market dynamics and potential pricing dynamics. Look to your mill rep for actual lead times and prices.