Prices
July 24, 2025
HR Futures: Curve switches gears
Written by Joshua Toney
After a period of backwardation driven by headlines and CRU index anchoring, the CME hot-rolled coil (HRC) curve structure has undergone a notable shift. Futures now reflect stronger expectations across the second half of 2025, with a slight contango emerging beyond July ‘25 expiries.
Spot and curve overview
The Nucor Consumer Spot Price (CSP) moved down $10 per short ton (st) this week to $900/st. While that level is familiar territory, index-based assessments have yet to firmly clear the $900 threshold.
Futures markets currently price limited potential for sustained trade above $900/st. Just a month ago, August ’25 was the only contract near that mark. Since then, we’ve seen a visible flattening of the curve.
The steep backwardation of late June has given way to modest contango beyond near-term contracts. At month-end June, the curve spread from July to November ’25 was +$60/st.
As of today, that same curve segment is compressed to +$21/st. Most notably, the August ’25 to February ’26 spread has flipped from +$21/st to -$32/st — a $53/st reversal in just 30 days.
While this represents a relatively modest $2.40/day over 22 trading days, it’s been enough to shift the entire curve structure.
CME HRC curve structure today vs. 1-month historical
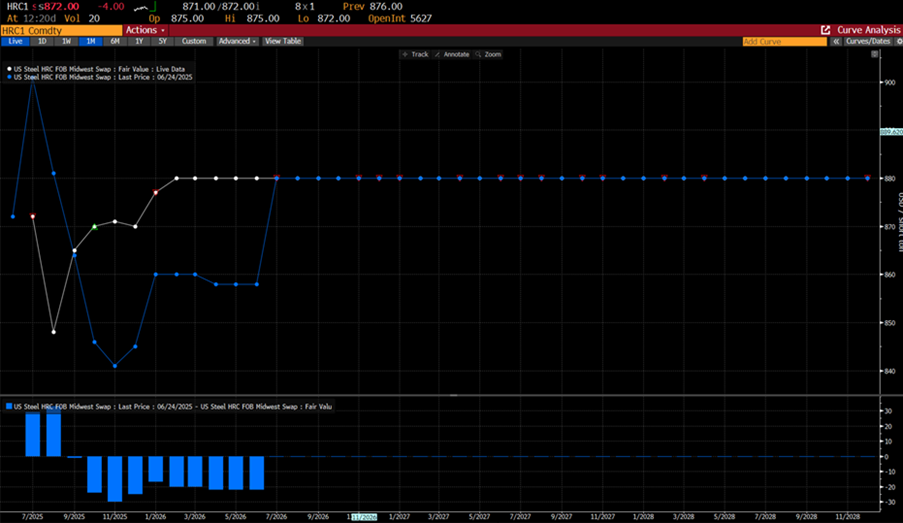
Source: Bloomberg, CME
Market positioning (CFTC Commitment of Traders)
As of July 15, CFTC reporting, physical participants added 25,340/st to their short positioning.
Managed money remains net long but only added 2,120/st vs. the July 8 data. Swap dealers are positioned long and taking on spread positions adding 8,800 st to their longs and 2,040 st to their spreads.
Other reportables remain net short but added to their long and spread positions. Overall, physical hedgers appear to be increasing downside coverage while financial players maintain a cautiously bullish bias.
Mill margins
Rolling mill margins remain healthy. Looking ahead, the HRC-BCH futures spread (Sept. ’25 HRC vs. Oct. ’25 Busheling) sits in the $375–$390/st range. This supports continued conversion profitability, even as physical busheling levels for August are anticipated to land between $460–$475 per long ton. Next week’s front-month roll on the CME will align physical and financial benchmarks for better margin tracking.
US mill margin 6-month chart (US CME HR – CME BCH) rolling basis.
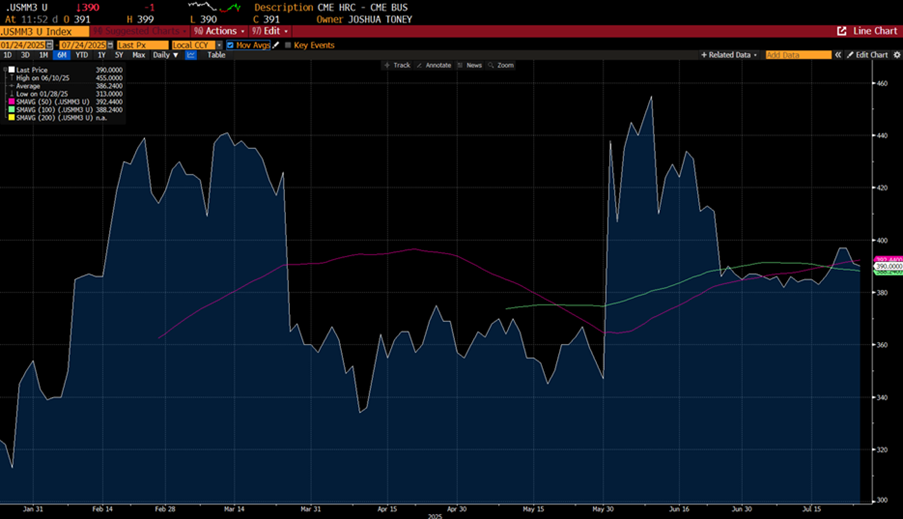
Source: Bloomberg, CME
Conclusion:
The sharp shift in forward pricing and hedging posture reflects a more measured outlook across both financial and physical market participants. While margins remain resilient, the flatter curve suggests more balanced expectations heading into Q3.
Disclaimer:
The views and opinions expressed in this column are solely those of the author, Joshua T. Toney, Principal of Corsair Elements LLC. This material is provided for informational and educational purposes only and does not constitute investment, trading, legal, or financial advice. Corsair Elements LLC is not registered with the Commodity Futures Trading Commission (CFTC) or the National Futures Association (NFA). Nothing contained herein constitutes a solicitation or recommendation to buy or sell any commodity interest, futures contract, swap, or other financial instrument. Readers should consult their own professional advisors before making any financial decisions.