Prices

October 26, 2017
Hot Rolled Futures Rally on Mill Price Hikes
Written by David Feldstein
The following article on the hot rolled coil (HRC) futures markets was written by David Feldstein. As the Flack Global Metals Director of Risk Management, Dave is an active participant in the hot rolled futures market, and we believe he provides insightful commentary and trading ideas to our readers. Besides writing futures articles for Steel Market Update, Dave produces articles that our readers may find interesting under the heading “The Feldstein” on the Flack Global Metals website, www.FlackGlobalMetals.com. Note that Steel Market Update does not take any positions on HRC or scrap trading and any recommendations made by David Feldstein are his opinions and not those of SMU. We recommend that anyone interested in trading HRC or scrap futures enlist the help of a licensed broker or bank.
Here we go again. Did you buy them dips?
If not, well you might have missed the boat once again.

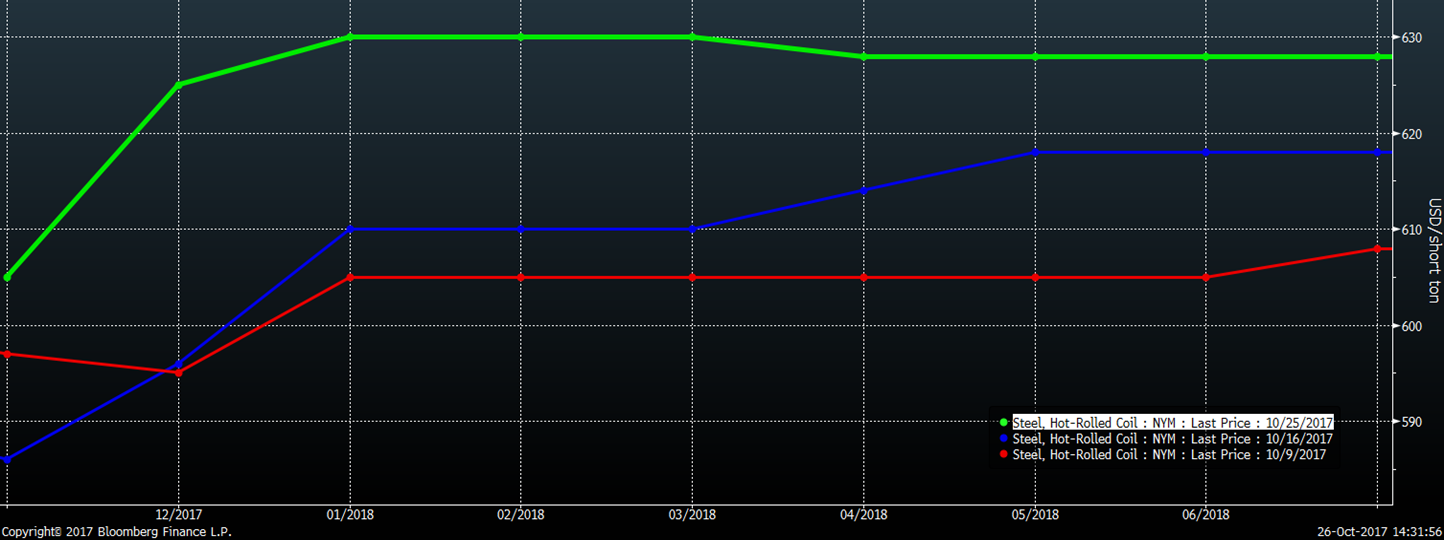
Below is the CME Midwest HRC futures curve as of Wednesday night’s close. The curve has rallied about $20/st in 12 trading days. November is trading around $605, December at $620 and 2018 in the high $620s.
CME Midwest HRC Futures Curve
Nothing you can do about it now, so let’s look ahead. Its been a little tricky out there because the fundamentals have been rock solid, but sentiment has been sour. Some have attributed the recent weakness to the overhang of excess tons bought in response to the 232 investigation. However, the lack of import deals made in the May through July period due to the Section 232 investigation, and the closing of attractive import differentials currently and going back to late July, supports the view that imports will continue to decline precipitously in the near term and stay depressed into 2018 unless global price dynamics change.
Check out these two charts that map the differential between the Platts Midwest HRC price and each of the respective countries’ export prices through time.
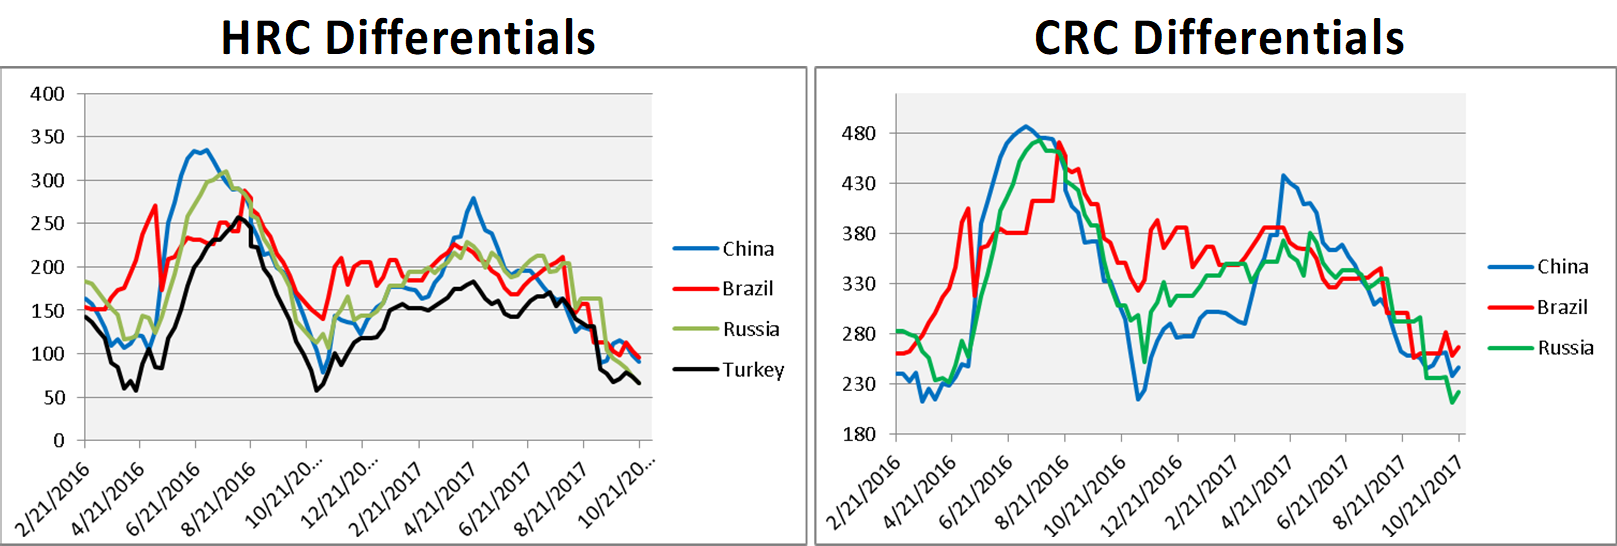
Notice current differentials are at or below the low levels reached in March 2016 and late October 2016.
The chart below is of the Platts TSI Daily Midwest HRC Index. The red arrows point to March 2016 and late October 2016, when the differentials reached their low points.
Platts TSI Daily Midwest HRC Index
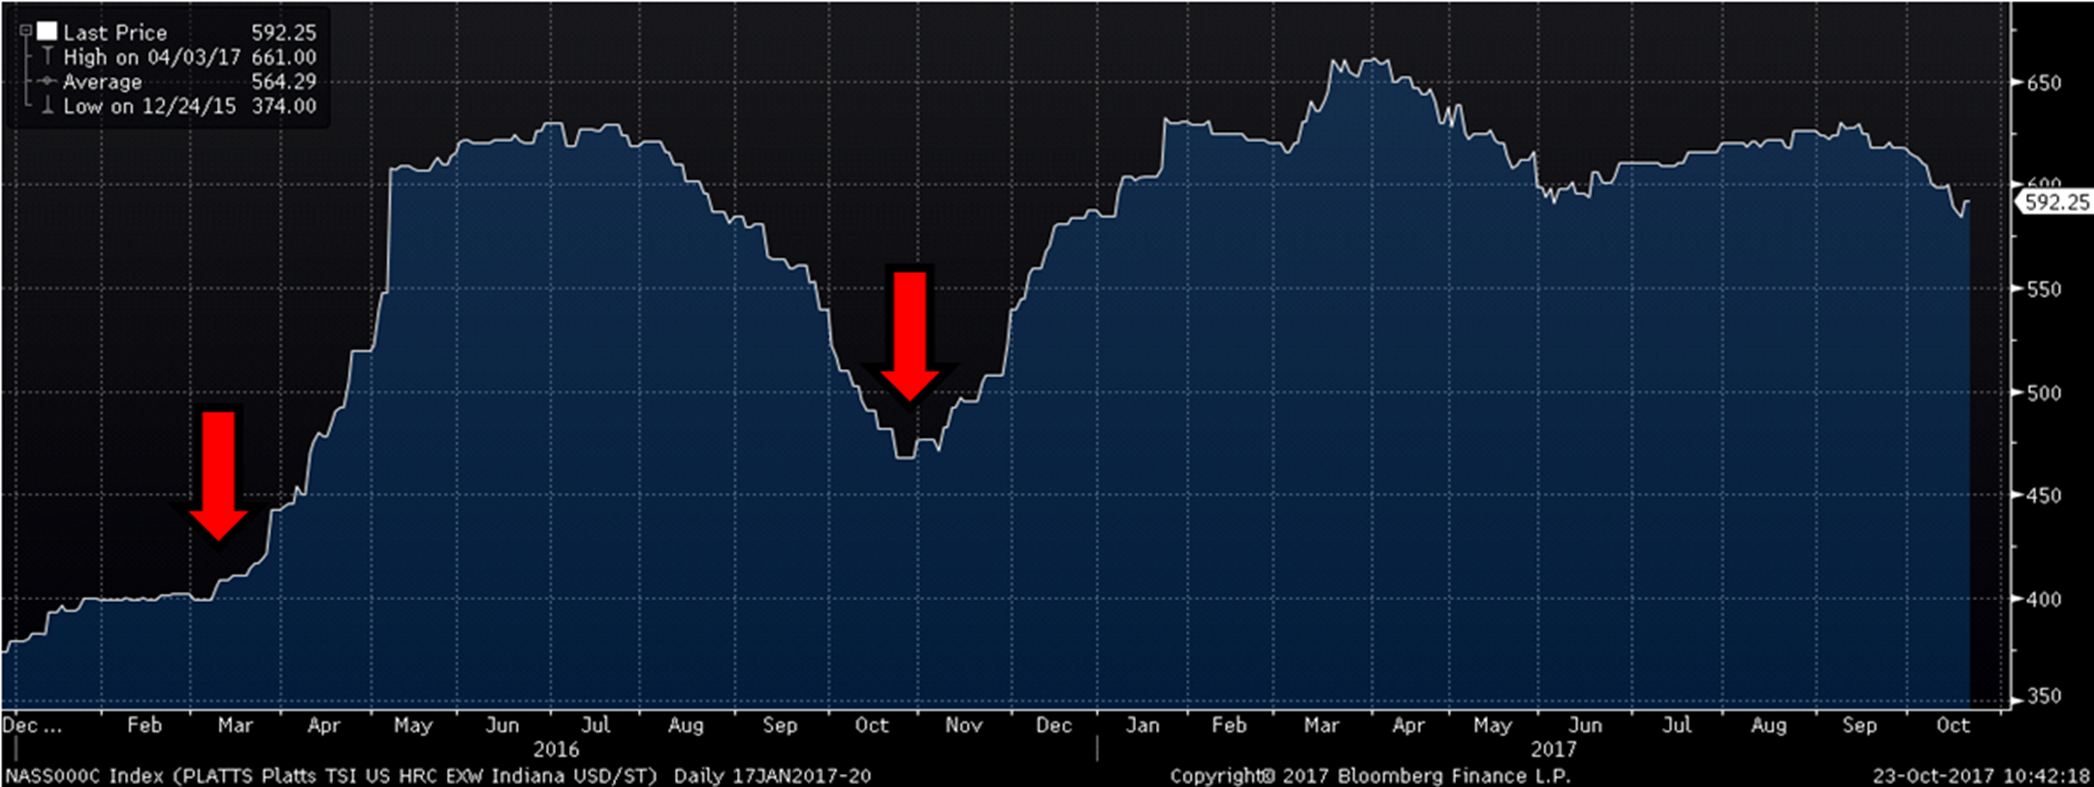
As you can see, massive rallies followed. On March 7, 2016, the TSI Midwest HRC Index was $399/st. Two months later, the index was $608/st, a gain of $209/st or 52 percent. On Oct. 28, 2016, the TSI Midwest HRC Index was $468/st. Three months later, the index was $632/st, a gain of $164/st or 35 percent. While not statistically significant, these two instances and the current dynamics warrant caution if your business has upside price risk or is entering into fixed price contracts that increase upside price risk.

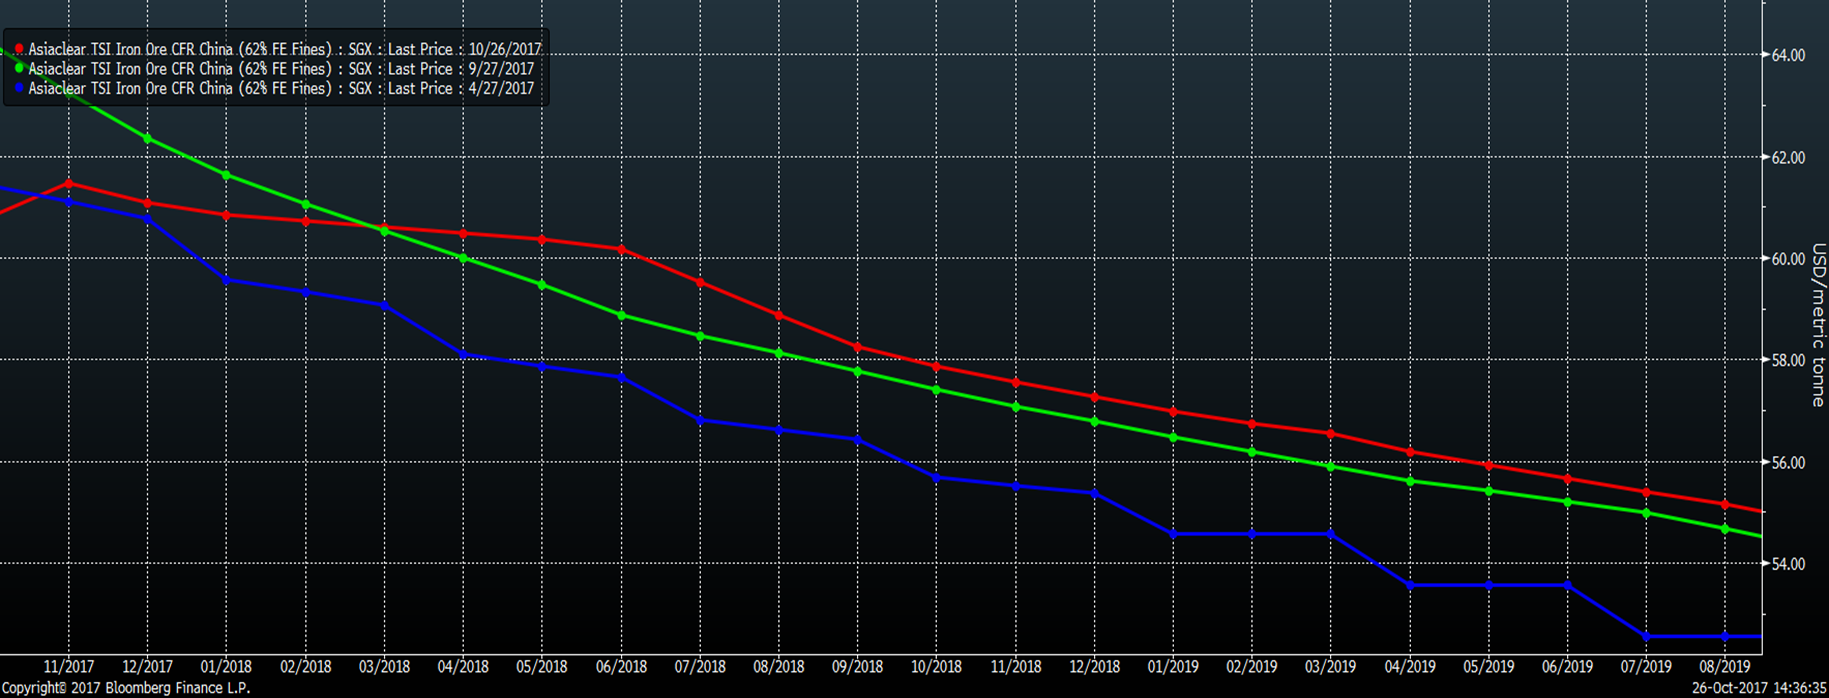
A very interesting thing happened in the iron ore market last week. The front of the curve flattened out for the first time in years (red line). This is most likely in response to China’s winter production curtailment. Some flattening was seen in the LME Turkish scrap futures in response. We will see how long this lasts.
In the last SMU article on Oct. 6, the development of a “reverse head and shoulders” pattern in the rolling second month HRC futures chart was discussed. While it isn’t perfect, the right shoulder has almost completely developed. See below.
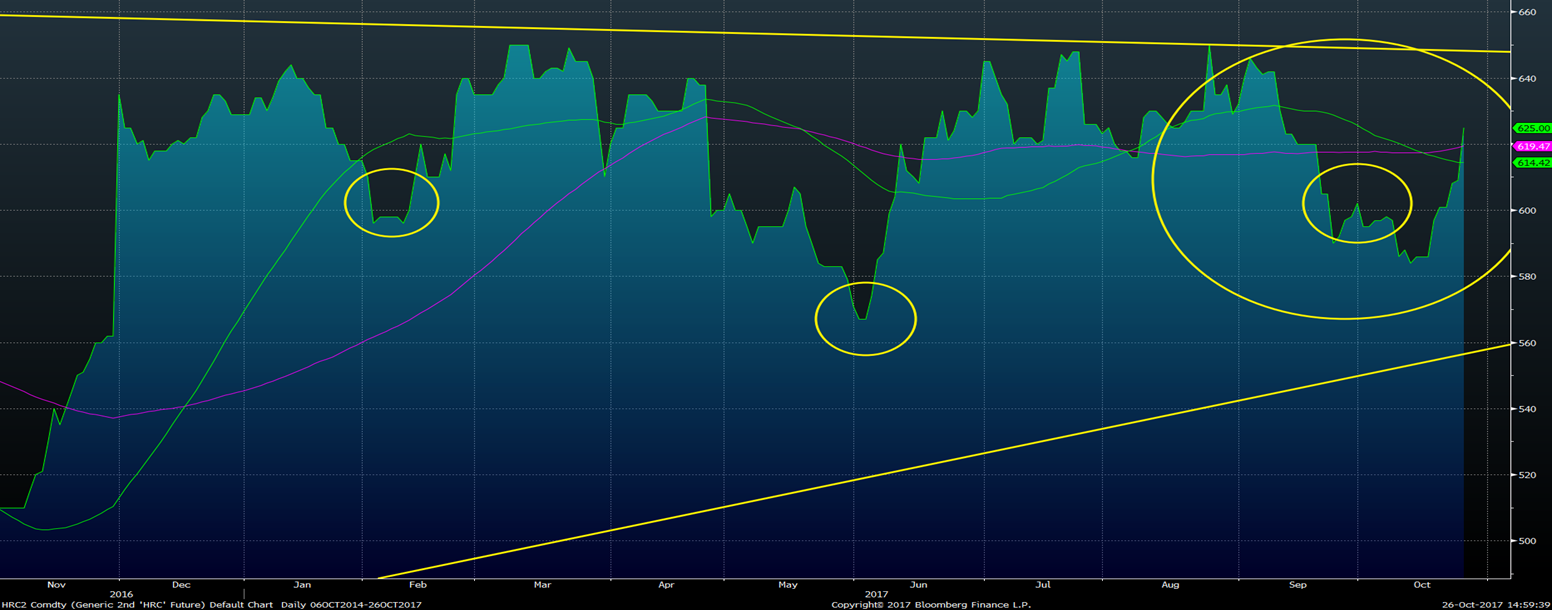
And as you can see below by comparing the shoulders of Gronk and Igor from Young Frankenstein, not all shoulders are perfectly symmetrical. Same as in the chart above. Sometimes you have to give the pattern a little leniency and think more in terms of what the price movement is expressing. Great knockers by the way.

If the HRC price breaks above the $650 “neckline,” this chart pattern indicates a significant rally will follow.
Folks, the dynamics of 2015 are long gone. We have been in a multi-year bull market that has been consolidating in a range for almost a year. It’s a coiled spring!
Taking the import differential chart above and the monster rallies that followed the last two times differentials were this low, the reverse head and shoulders pattern that is developing and the best industry fundamentals in years, well don’t be surprised if prices explode to the upside in the coming months. Are you prepared for HRC in the $700s?
The opportunity might present itself in HRC futures at any time, so pay close attention to President Trump’s Tweets, keep your local broker on speed dial and remember Ferrous Bueller’s philosophy…
“Life moves pretty fast. If you don’t stop and take a look around once in a while, you could miss it.”