Prices

June 21, 2018
Hot Rolled Steel and Scrap Futures: Anticipating the End of a Price Trend?
Written by Jack Marshall
The following article on the hot rolled coil (HRC) steel and financial futures markets was written by Jack Marshall of Crunch Risk LLC. Here is how Jack saw trading over the past week:
Steel
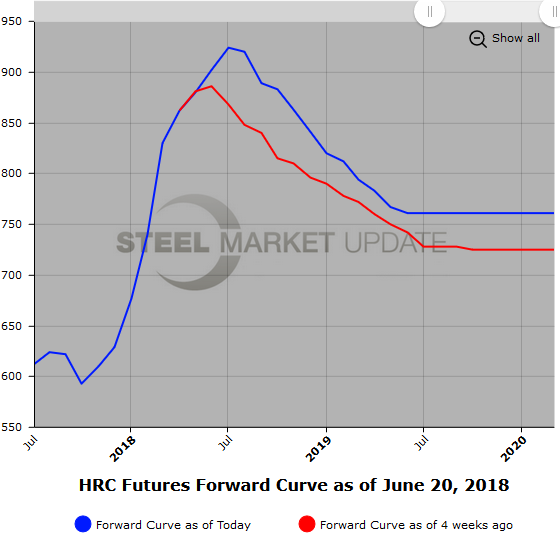
While the HR indexes continue to grind higher in a somewhat non-linear fashion, the HR futures curve is reflecting an even sharper price decline in the longer dates as measured since the beginning of June. Activity has been rather sporadic as the continued uncertainty over trade and tariffs has kept folks sidelined along with the $900/ST prices. Intermittent buyers, especially in longer dated HR futures, has led to lower volume trading and additional price pressure.
For reference, today’s average weighted prices trading in Q1’19 and Q2’19 are $17/ST and $22/ST lower than the June 1 settlements. Basis today’s average weighted prices traded in Q3’18 and Q4’18 have seen a smaller dropoff as prices have declined -$2/ST and -$5/ST when compared to June 1 settlements.
As spot hovers over $900/ST, the Dec’18 future is trading at $835/ST (today’s average weighted price) a $65-75 discount to spot and the Jun’19 futures are trading at $756/ST, a $144-$154 discount to spot.
Given recent uncertainty, we can expect the shape of the curve to shift fairly rapidly. The current shape of the curve seems to reflect an expectation that the current potential supply constraint will be offset by additional domestic supply expected to come on line by the end of the year. Of course, demand could also drop off due to the much higher prices.
Below is a graph showing the history of the CME Group hot rolled futures forward curve. You will need to view the graph on our website to use its interactive features; you can do so by clicking here. If you need assistance with either logging in or navigating the website, please contact Brett at 706-216-2140 or Brett@SteelMarketUpdate.com.
Scrap
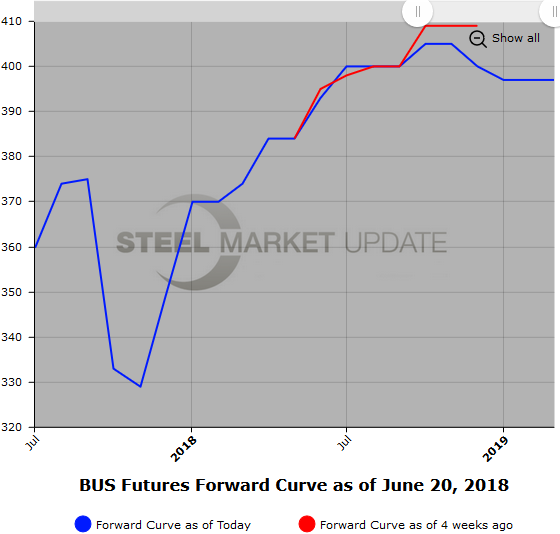
BUS futures prices have backed off slightly from the beginning of June with the curve out through Dec’18 still relatively flat and hovering just above $400/GT. Q1’19 BUS futures traded this week just below $400/GT at $397/GT. Prices further out the curve at present have held up. Perhaps this reflects additional demand anticipated from the rise in capacity utilization for HR mills. However, the stronger dollar could boost scrap supplies in the form of increased scrap imports from Europe.
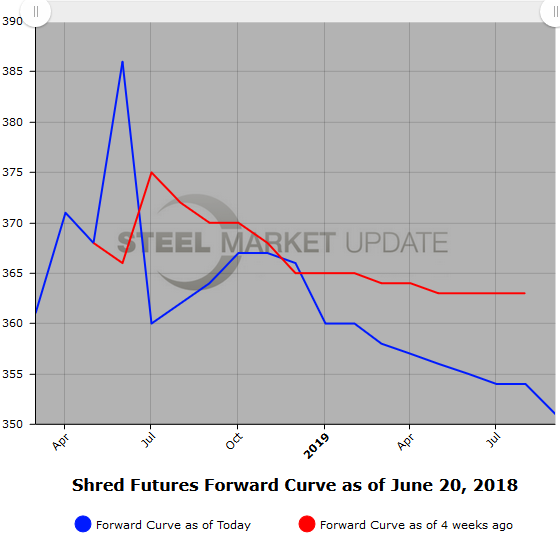
USSQ futures are also hovering close to the Jun’18 index ($364). Oct and Nov’18 have been bid at $365/GT this week. USSQ futures curve remains relatively flat with just a slight backwardation. The one-year calendar spread based on settles is running at about a $10 discount.
80/20 scrap futures are trading well below shred with the Oct and Nov’18 hovering around $330/MT this week. USD strength is creating some softness. The Jul’18 versus Dec’18 calendar reflects a $30 backwardation discount based on the latest settles.
Below is another graph showing the history of the CME Group busheling scrap futures forward curve. You will need to view the graph on our website to use its interactive features; you can do so by clicking here.
We have started tracking USSQ shredded scrap futures, shown below. Once we have built a sizeable database, we will add this data to our website.