

Prices

July 30, 2020
Hot Rolled Futures: Stretching the Rubber Band
Written by Tim Stevenson
SMU contributor Tim Stevenson is a partner at Metal Edge Partners, a firm engaged in Risk Management and Strategic Advisory. In this role, he and his firm design and execute risk management strategies for clients along with providing process and analytical support. In Tim’s previous role, he was a Director at Cargill Risk Management, and prior to that led the derivative trading efforts within the North American Cargill Metals business. You can learn more about Metal Edge at www.metaledgepartners.com. Tim can be reached at Tim@metaledgepartners.com for queries/comments/questions.
China continues to drive ferrous markets. Ore prices remain well over $100/ton as demand from China remains robust. There have been some comments recently out of China and Australia, noting that supplies of ore should improve later in 2020, and that may well happen. We have already seen ore inventories start to rise, as shown in the following chart:
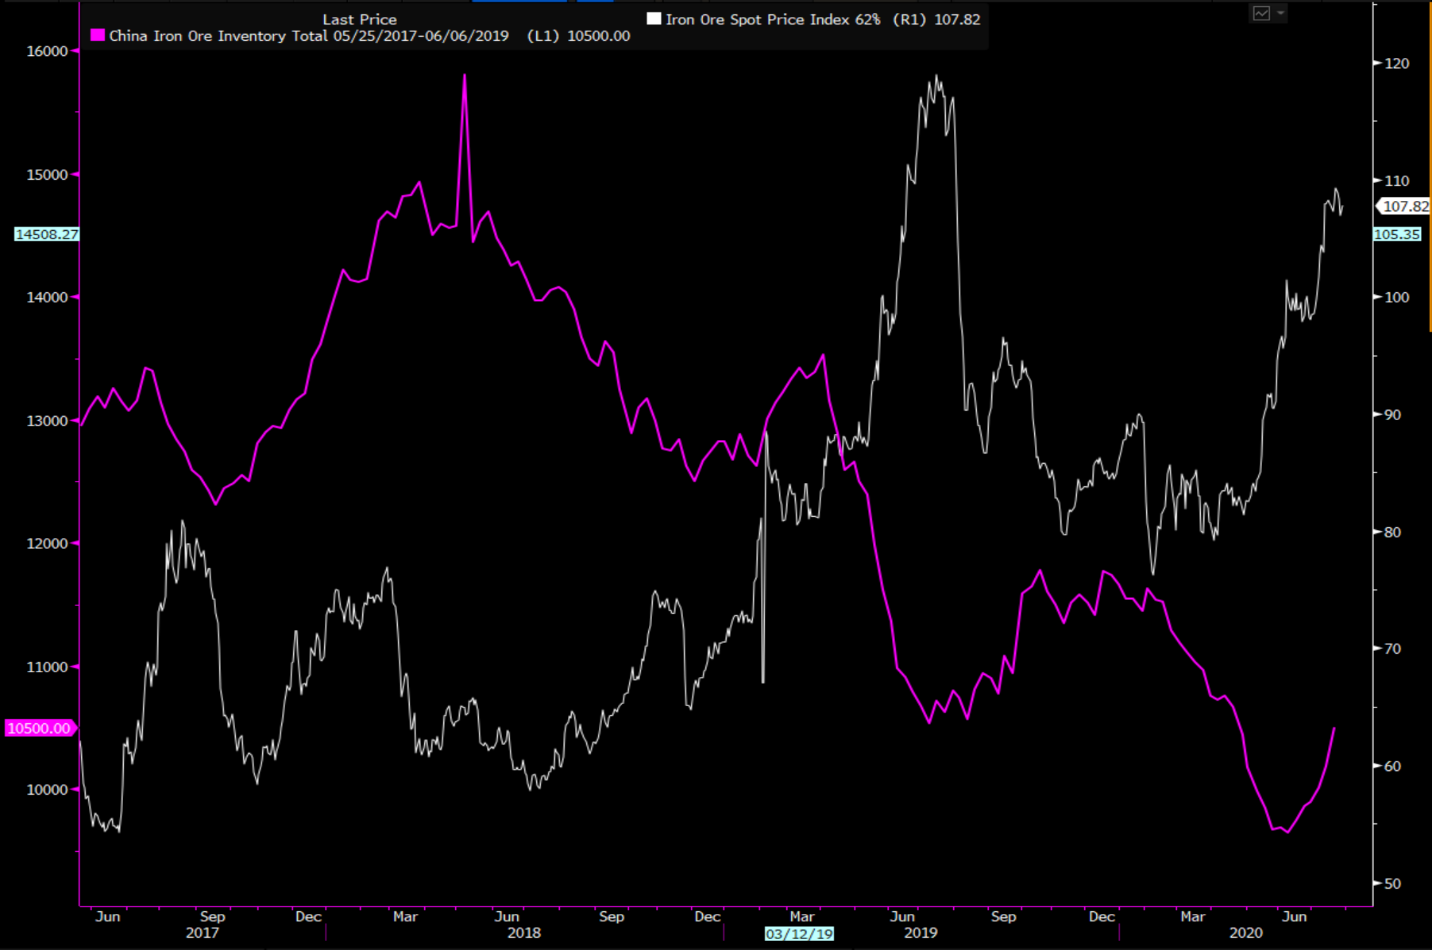
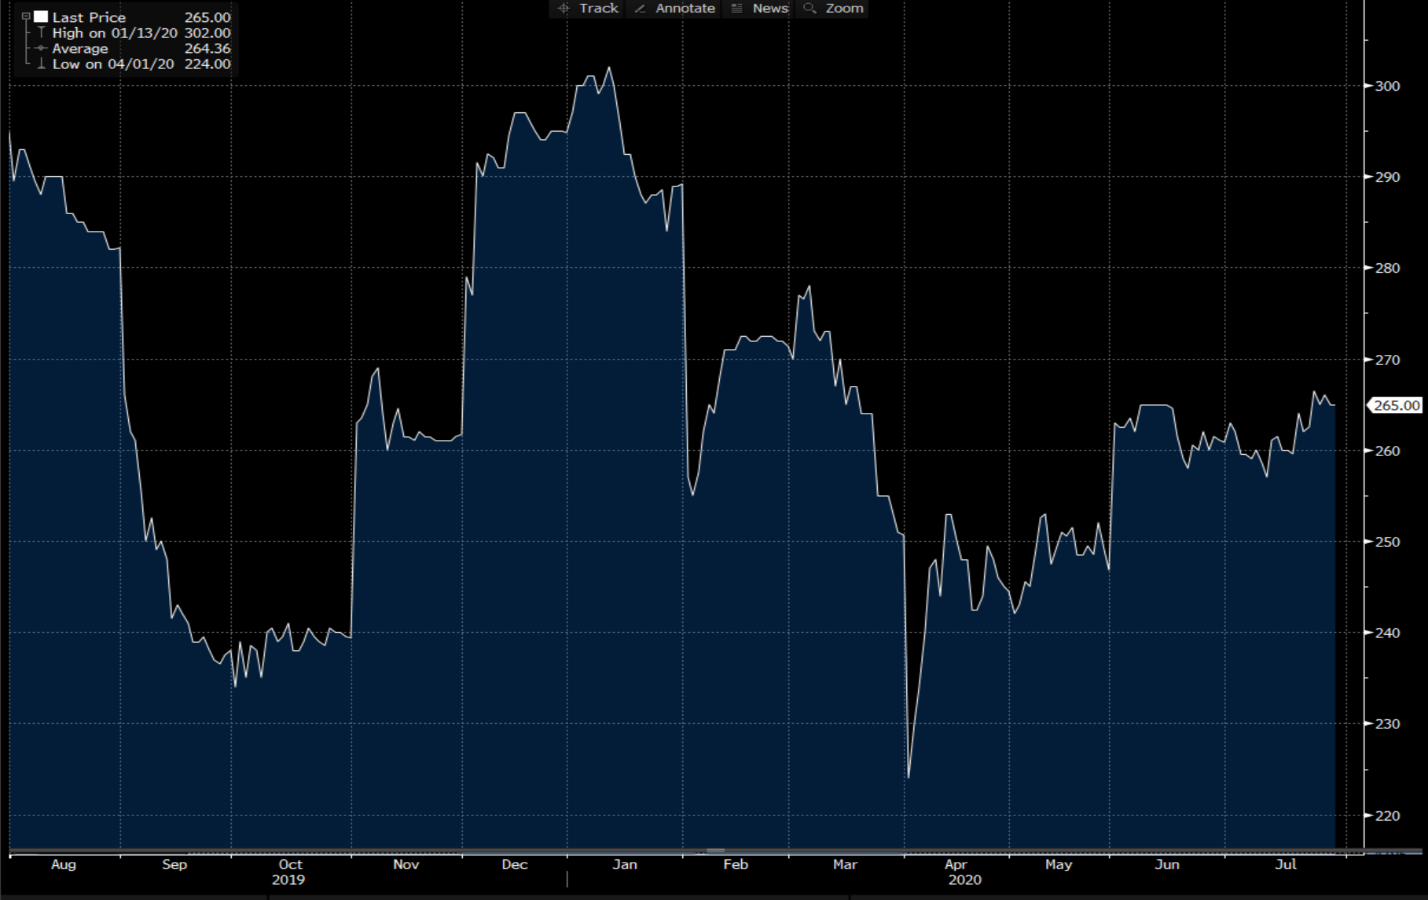
A number of reasons have been given for the rise, and certainly strong deliveries out of Australia have been a part of it. But in thinking about the absolute levels of inventory, they are still quite low. In June, China produced over 91 million tons of steel. Annualized, this is over 1 billion tons. If we assume that 90 percent of the steel is produced in blast furnaces (rough estimate), that would mean 900 million tons is produced using iron ore. Assuming 1.5 tons of ore is needed to produce a ton of steel, they’ll chew through north of 1.3 billion tons of ore over the course of a year. So, if Chinese inventories as shown by Bloomberg are just over 100 million tons—that’s less than one month of production. In addition, it looks like China became a net importer of steel during the month of June. The last time this happened was in 1H 2009. So, they are producing a billion tons of steel on an annual basis, and also importing additional material! Pretty amazing. China’s strength has firmed up the Turkish scrap mart as well, as they’ve bought some HRC and rebar from Turkey recently. The chart below is the front month Turkish futures contract, which is starting to show an upturn. In addition, there have been physical market transactions above $270/ton recently.
And now we will share a chart that reminded us of the “rubber band” analogy. The following chart compares iron ore prices (CFR Qingdao) and the front month U.S. HRC contract. We’ve taken the percentage change in price starting in January of 2016. You can see the huge run in U.S. HRC prices in 2018 due to the Section 232 tariffs, and then the massive divergence since that time. While these two ferrous commodities are in completely different parts of the world, there is good reason to think that at some point in the future they shouldn’t diverge by this much—at least for an extended period of time. Market forces will come in to bring this relationship back into a more normal range.
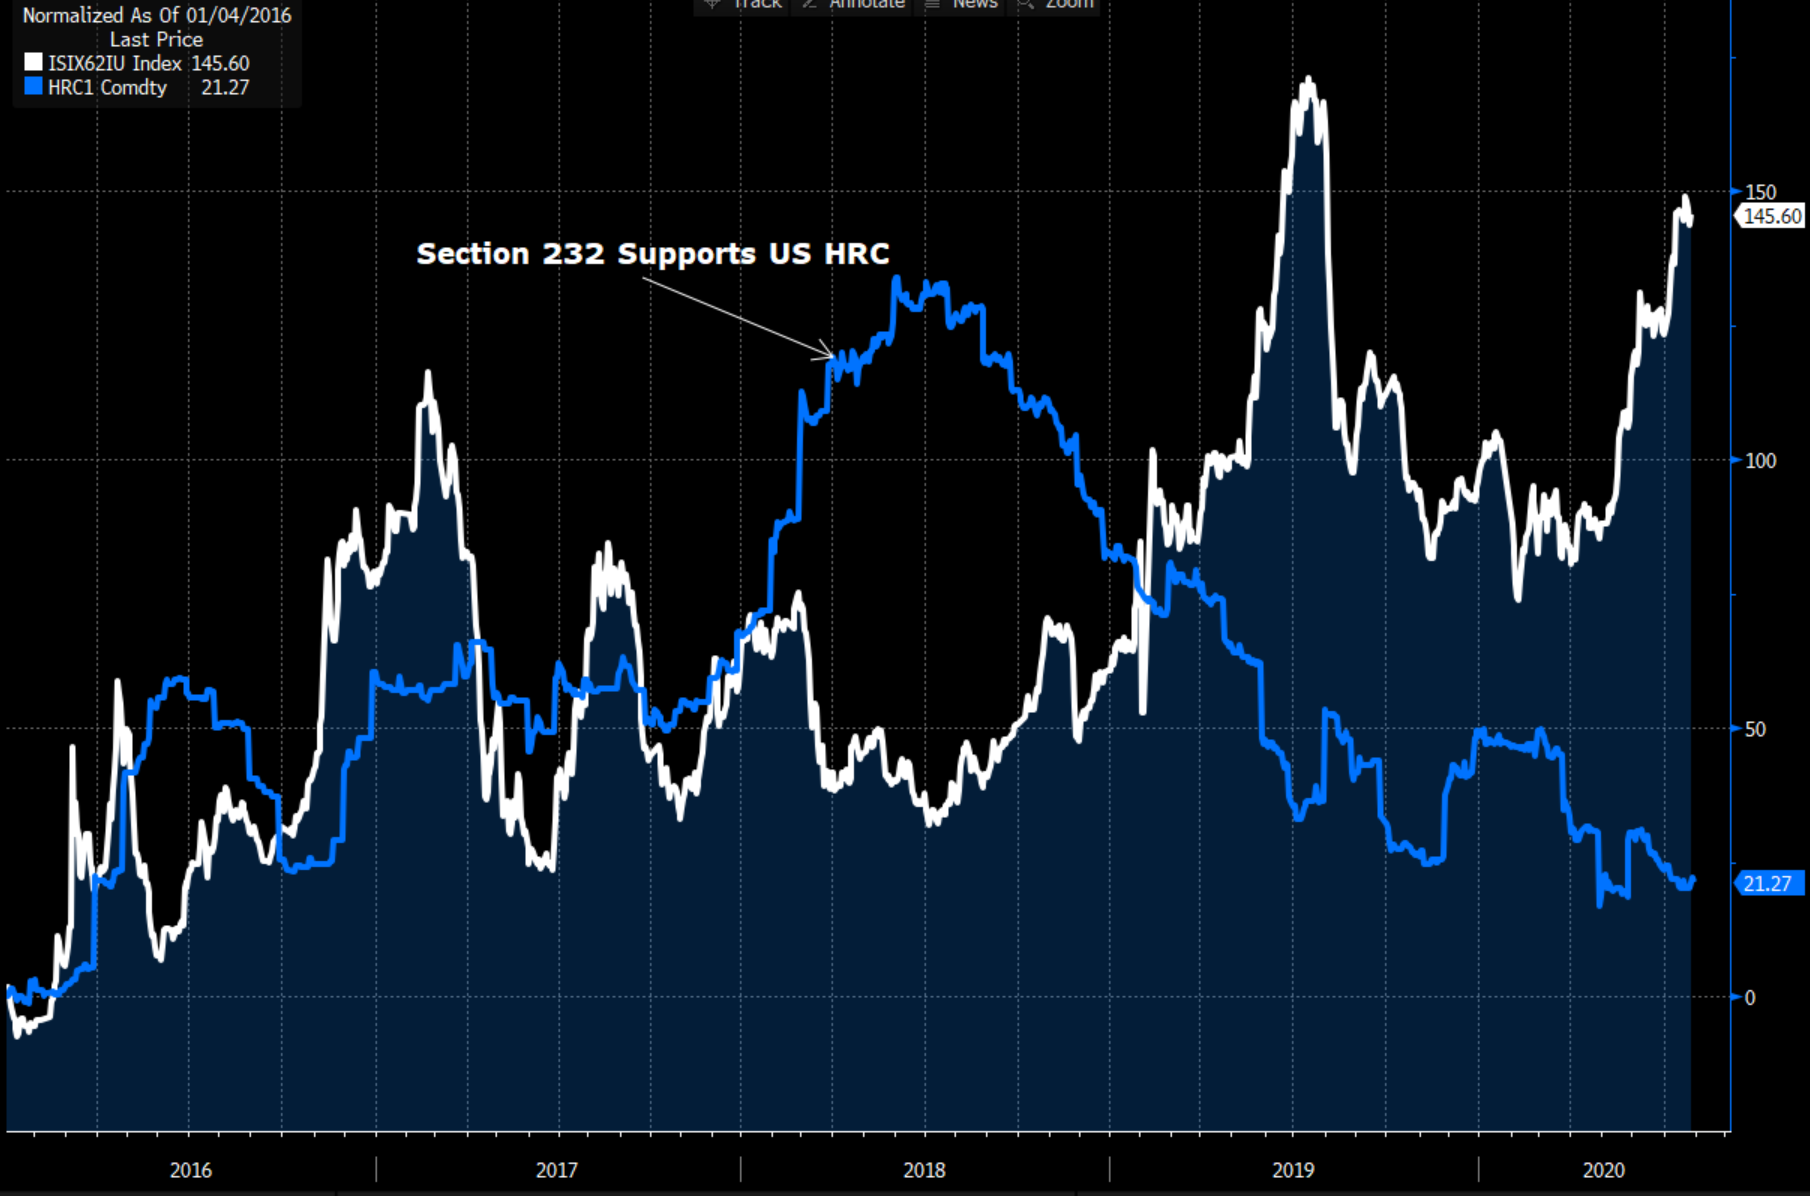
You can see that the Section 232 trade actions supported U.S. HRC and pushed it up significantly relative to ore. However, this bullishness has dissipated steadily since mid-2018 and now HRC is the clear underperformer.
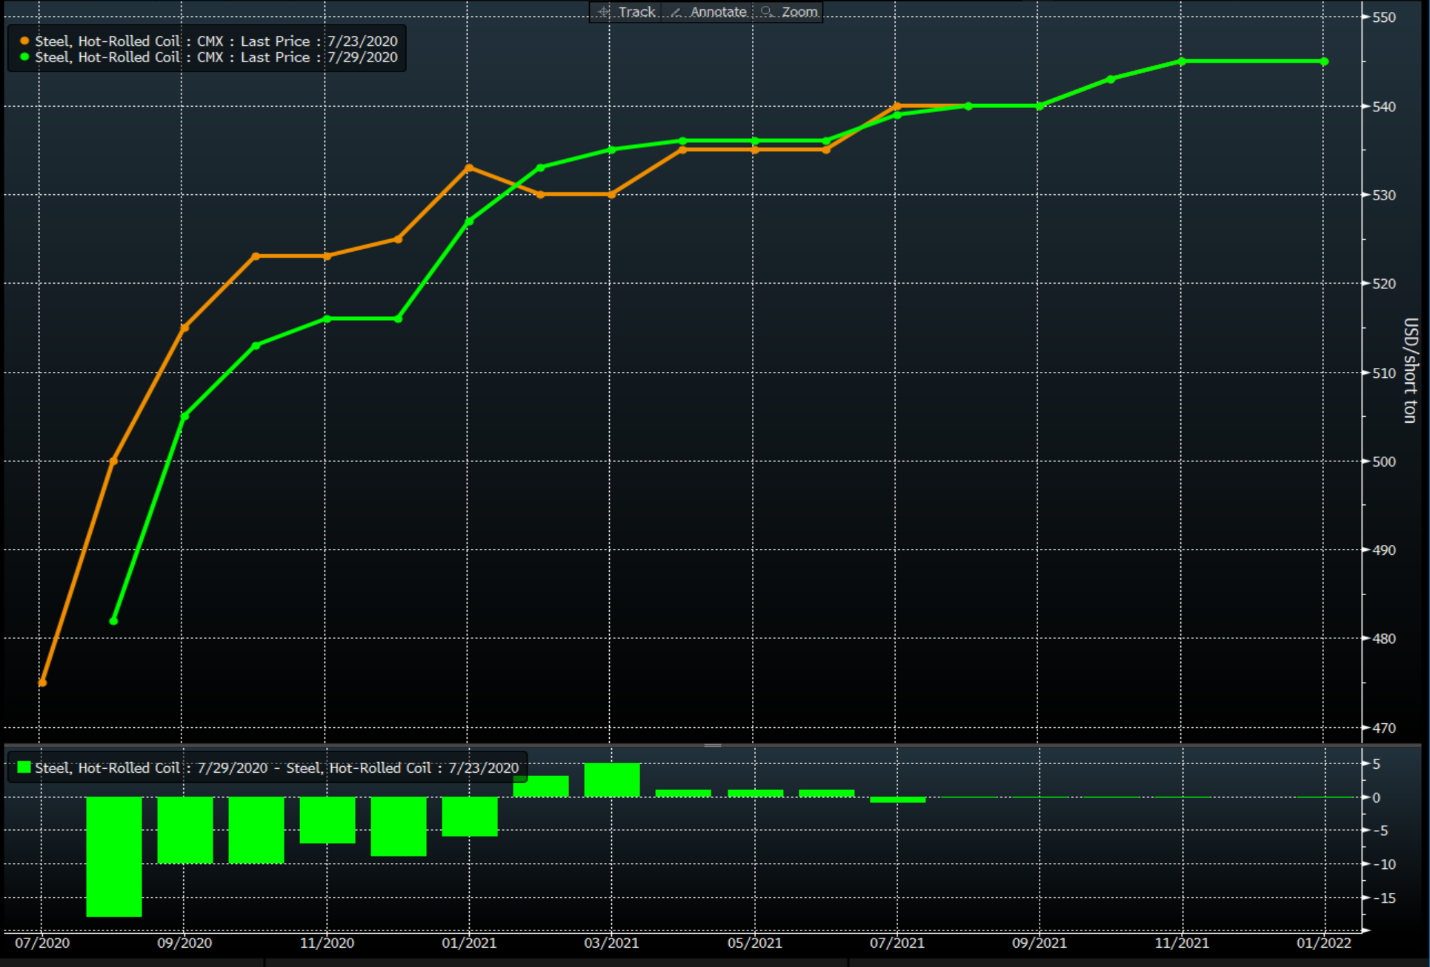
Despite all this, U.S. HRC futures prices fell over the past week across all the remaining months in 2020. This was possibly a result of short lead times and weaker scrap price sentiment. 2021 remains well supported, however, as consumers continue to see this period as attractive versus long-term average HRC price levels. The curve is also in a strong “contango”—meaning prices further out on the curve are higher than prices in the nearby months. This is not uncommon when supplies of a commodity are currently excessive. The market is assuming that this oversupply will be rectified in the future by either higher demand or lower supply, and thus prices in the future are likely to be higher.
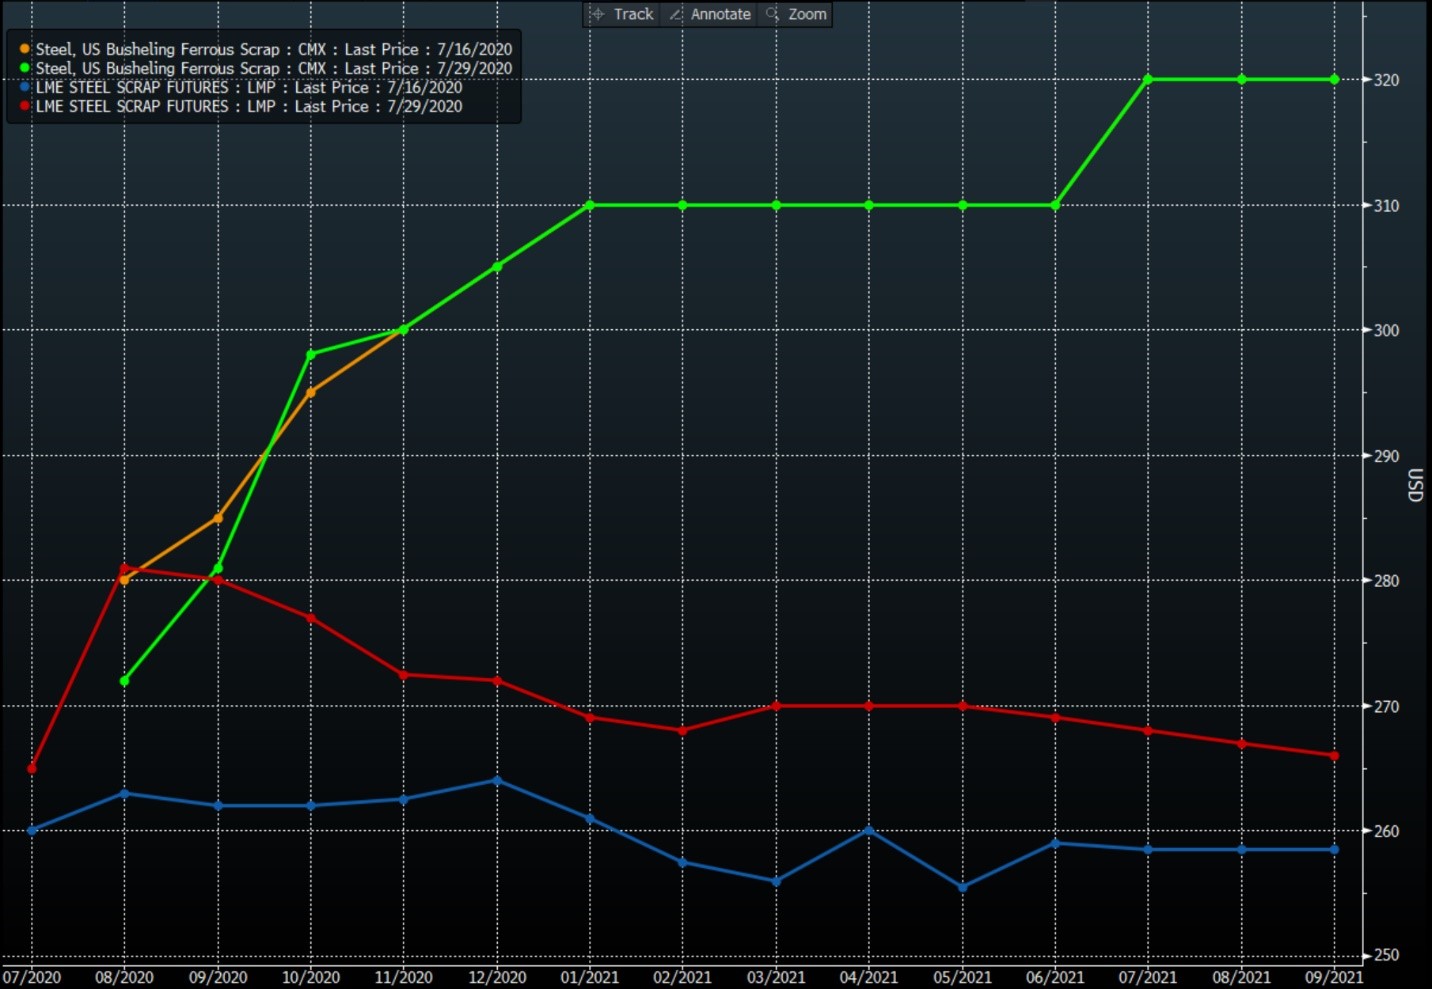
Speaking of scrap, a couple of things stuck out about the following chart. First, Turkish scrap has moved significantly higher over the past two weeks as China has come in to buy steel from Turkey. U.S. busheling prices haven’t moved much except for a small decrease the August and September months. Also of note is that the Turkish curve is in “backwardation” (forward months at lower prices than spot), while busheling is in contango. Some possible reasons for this would be that the Turkish curve is simply following the ore curve, which is also in backwardation. Busheling may be anticipating the start of new steel mill capacity here in the U.S. and is expecting demand for the material to be higher.
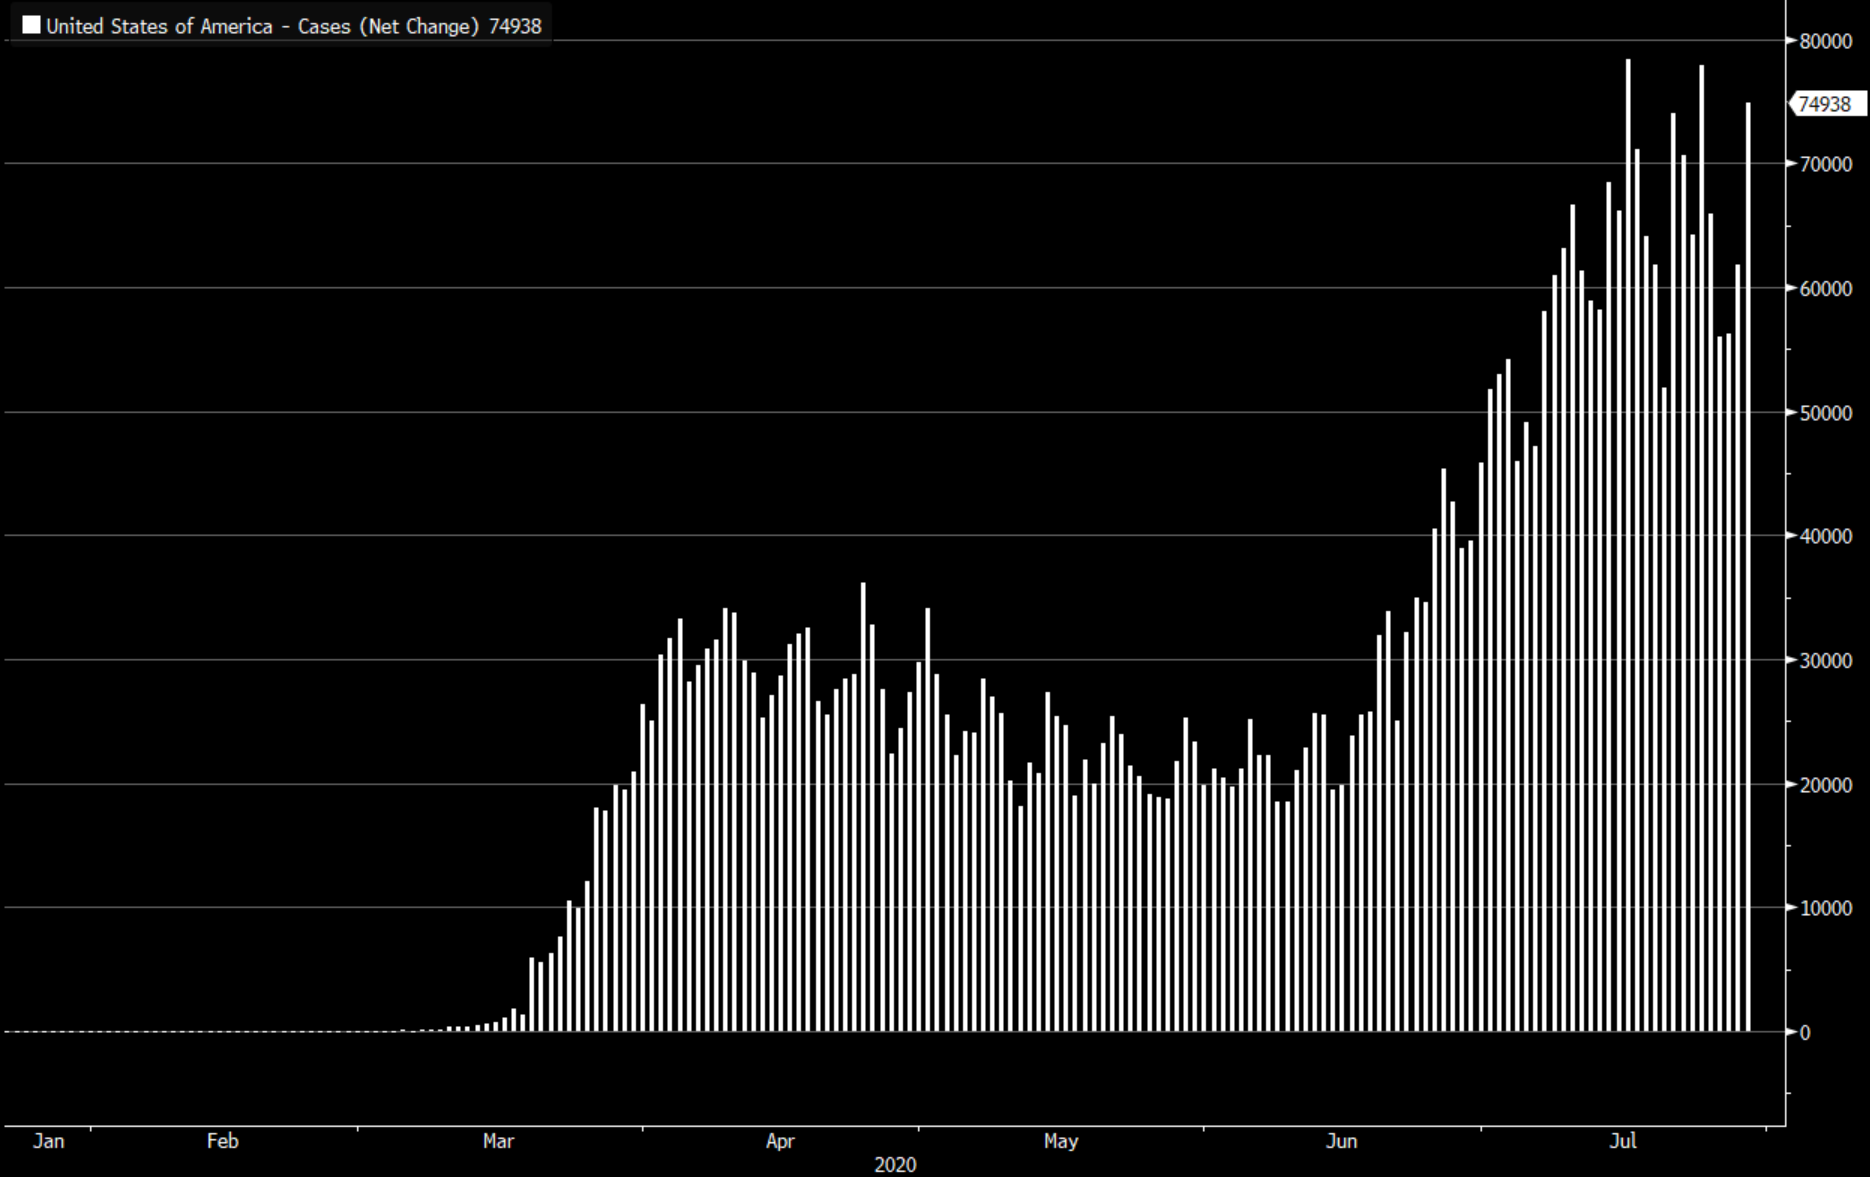
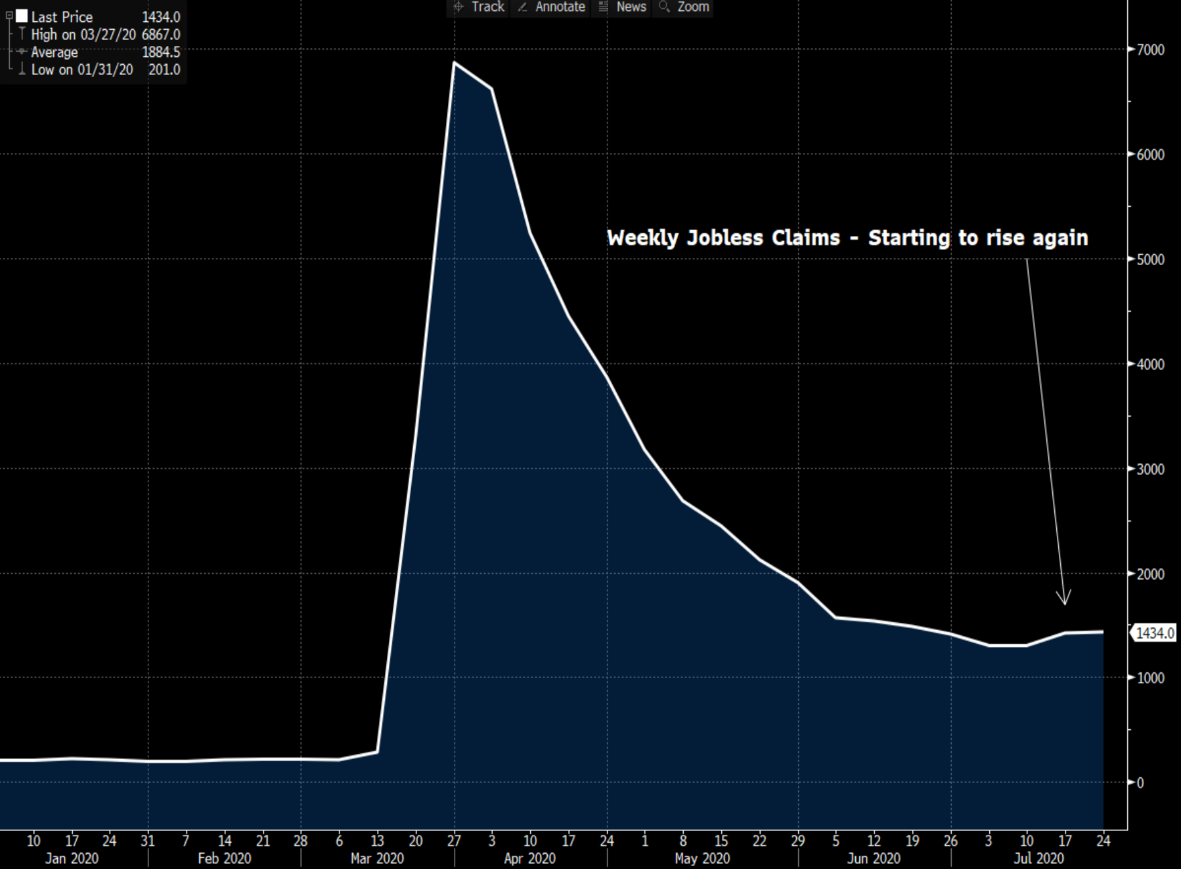
On the overall U.S. economy, over the past month the news has been dominated by the surge in new virus cases. This is certainly a problem, but to us, it looks like the new case growth may be flattening again—and let’s hope that trend continues. Second, on the right chart, is the weekly jobless claims data. This is a bit disconcerting as it shows how in the past two weeks we’ve seen the steady streak of decreases in this series come to an end as layoffs resume.
From our perspective the trends in China continue to be positive for the ferrous complex, but it’s hard to know how long this will last. Some fears of a “double-dip” may be emerging in the U.S. economy on virus-related concerns, but should the recovery here continue, it would seem that prices in Asia and the U.S. need to converge at some point—either with Asia slipping or the U.S. finding stronger footing. The question is when.
Disclaimer: The information in this write-up does not constitute “investment service,” “investment advice” or “financial product advice” as defined by laws and/or regulations in any jurisdiction. Neither does it constitute nor should be considered as any form of financial opinion or recommendation. The views expressed in the above article by Metal Edge Partners are subject to change based on market and other conditions. The information given above must be independently verified and Metal Edge Partners does not assume responsibility for the accuracy of the information

