

Prices

September 30, 2021
HRC Futures Finish a Rough September
Written by David Feldstein
Editor’s note: SMU Contributor David Feldstein is president of Rock Trading Advisors. Rock provides customers attached to the steel industry with commodity price risk management services and market intelligence. RTA is registered with the National Futures Association as a Commodity Trade Advisor. David has over 20 years of professional trading experience and has been active in the ferrous derivatives space since 2012.
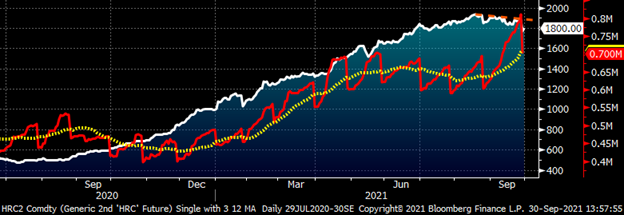
In the chart below of the rolling 2nd month Midwest HRC future, now November, the red line represents total open interest across the 36 months of HR futures and the yellow dotted line is the 22-day moving average of the open interest. The sharp drops in open interest occur when the front month expires. As you can see, open interest exploded in September.
Rolling 2nd Month CME Hot Rolled Coil Future $/st
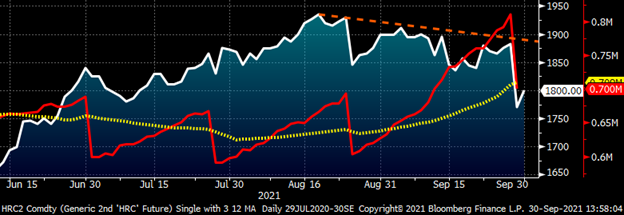
This is the same chart from above zoomed in so you can see more clearly what is happening. First, the sharp drop in open interest and the price from two days ago was the September future expiring and the November future moving into the 2nd month. Due to the steep backwardation or downward sloping futures curve, the price dropped from October’s $1,882 settlement on Tuesday to November’s $1,770 settlement on Wednesday. Despite that, you can see from the slight downtrend created by the orange dashed line with the HRC2 price peaking at $1,935 on Aug. 18. In previous articles, I discussed one of the most basic technical rules of thumb, namely that growing open interest moving with the trend makes it a technically strong bull or bear market.
Rolling 2nd Month CME Hot Rolled Coil Future $/st
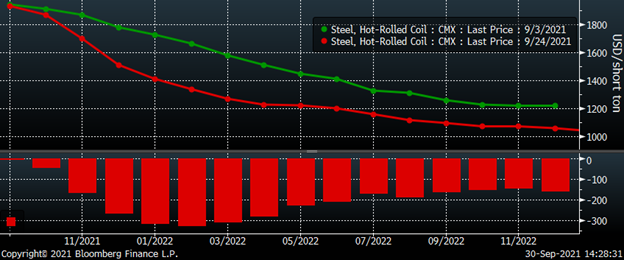
Taking a deeper look at the entire futures curve below shows that futures from November forward were under enormous selling pressure during the month of September. If the selling was previous buyers exiting their positions to take profits or perhaps mitigate their losses, then open interest would have contracted. Instead, the sharp increase in open interest tells us these were new positions put on and, based on the downward price movement, initiated by sellers. The months of the first quarter saw the most significant losses, falling over $300/st while every other month after October fell between $100-$200/st. The price action and open interest tell us HRC futures are now in a technically strong bear market.
CME Hot Rolled Coil Futures Curve $/st
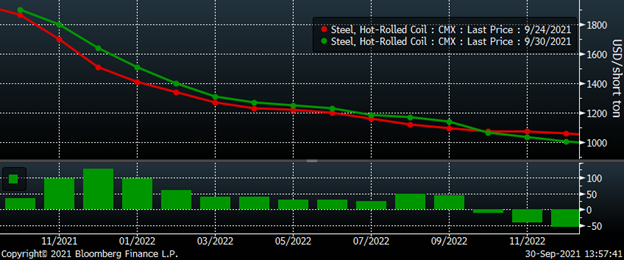
So far this week, there have been buyers coming in supporting the market, perhaps more physical buyers locking in discounted forward prices or short positions looking to take profits.
CME Hot Rolled Coil Futures Curve $/st
Last week, the Department of Commerce updated steel license data with August’s actual imported tons. About 379k short tons of “HR sheets” were imported, and this was an increase of 111k above the 270k short tons previously indicated by the license data.
HRC Imports st
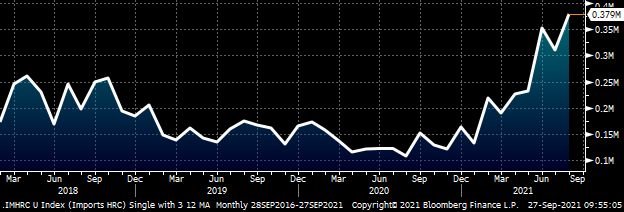
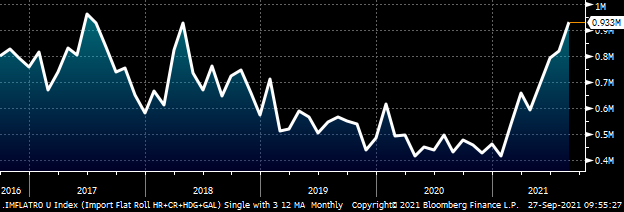
That sent the total of these four flat rolled sheet products to 933k short tons, an increase of 110k MoM. Considering that the Midwest HR price exploded above $1,500 in June to $1,800 by July and is now at $1,950, creating a massive premium over flat rolled prices across the globe, it can be assumed imports are going to keep coming in well into the first quarter. Perhaps the surge in imports and growing service center inventories, along with expectations for these trends to continue, are the major catalysts behind the aggressive selling in the futures market.
Flat Rolled Imports (HR+CR+HDG+Galvalume) st
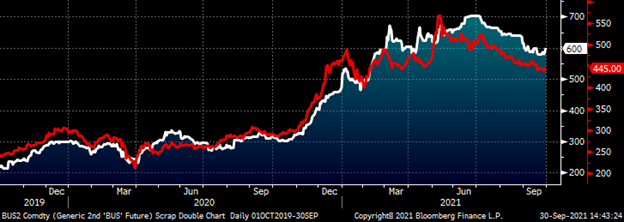
Scrap prices also continued their downtrend in August with Turkish scrap at $445/mt and busheling at $600/lt. Busheling has gained $15-20 this week as expectations for October’s busheling settlement have improved from down $20 to flat at $601.
Rolling 2nd Month CME Busheling & LME Turkish Scrap Futures
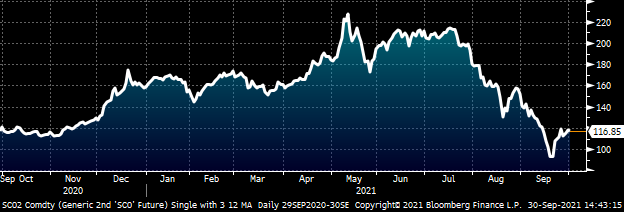
Iron ore has rebounded after trading as low as $95/t, however at $116.85, it is down almost 50% since its May peak.
Rolling 2nd Month SGX Iron Ore Future $/mt
What does this all look like 30, 60, 90 days from now? What will service center inventory look like? How high will flat rolled imports get? I believe these are the right questions to start with as you figure out where your price forecast should be.
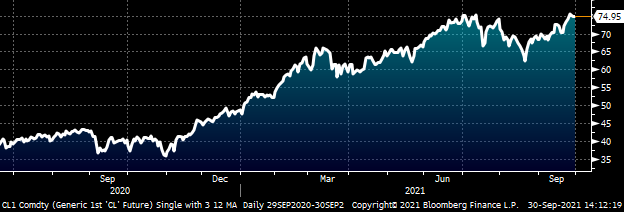
One bright spot appears to be the continued rally in oil, which was trading above $75/bbl today.
CME Front Month Crude Oil $/bbl
However, the euro has formed a head and shoulders pattern breaking below the neckline and below 1.16 today, indicating a sharp correction could be developing.
Euro/USD Cross
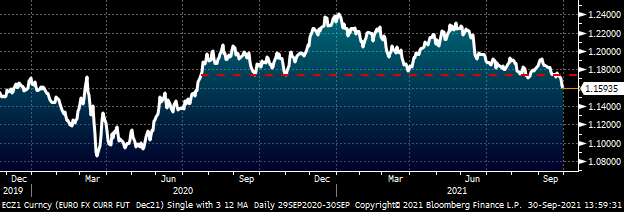
The euro accounts for 57.6% of the U.S. Dollar Index, so if the euro falls, the dollar rallies. The Dollar Index has been slowly gaining ground and is now above 94. A weaker dollar is a positive factor for commodities, while a strong dollar is a headwind. Base metals were all down 2% today. Keep an eye on the dollar as a sustained rally higher will weigh on metals and energy prices.
US Dollar Index

Disclaimer: The content of this article is for informational purposes only. The views in this article do not represent financial services or advice. Any opinion expressed by Feldstein should not be treated as a specific inducement to make a particular investment or follow a particular strategy, but only as an expression of his opinion. Views and forecasts expressed are as of date indicated, are subject to change without notice, may not come to be and do not represent a recommendation or offer of any particular security, strategy or investment. Strategies mentioned may not be suitable for you. You must make an independent decision regarding investments or strategies mentioned in this article. It is recommended you consider your own particular circumstances and seek the advice from a financial professional before taking action in financial markets.


