

Prices
September 28, 2023
HRC Futures Rally Hard on UAW Auto Strike
Written by David Feldstein
On Sept. 15, the United Auto Workers (UAW) went on strike at three plants, one of each of the Big 3. On Sept. 22, the UAW expanded its strike to 38 more GM and Stellantis plants. Since Sept. 15, the HRC futures curve has rallied $60-75 in the November – February futures months. The reason why there has been this breakneck rally is because, uh, well, um. I have no idea. I am as shocked by it as perhaps you are, frankly.
CME Hot-Rolled Coil Futures Curve $/st
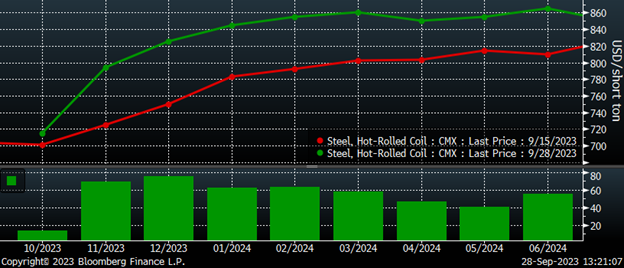
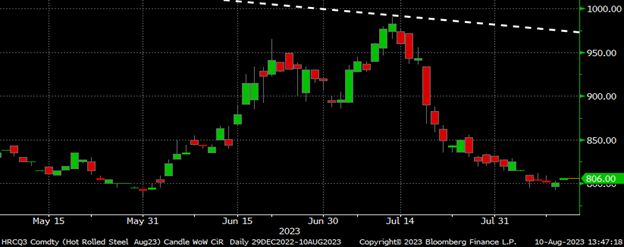
My last contributing article was on Aug. 10. That was before the SMU Steel Summit, where so much time was spent discussing the potential auto strike. In that article, I discussed the surprising rally in the August futures, screaming up from $800 around Memorial Day to as high as $995 in mid-July before eventually plummeting back to around where it started at $805. It appears that some market participant or participants lost a lot of money trading this future, while those that took the other side of those trades were rewarded handsomely.
August CME HRC Future $/st
“Stay open-minded” about pricing is something I like to say in these articles. Stay open-minded about this auto strike and about pricing. Thinking back to the Steel Summit, to the discussions, forecasts, and opinions about the strike. Would the UAW strike? If so, how? Would it be at one company or all three? I think the reality has surprised everyone, and that should remind us of how unpredictable not only this market is, but also has been for years. Remember Q1? Remember Russia’s escalation into Ukraine? Remember $1,900 hot rolled? Remember COVID? Remember Cliffs buying ArcelorMittal? The list goes on and on. This isn’t crazy, this is hot rolled.
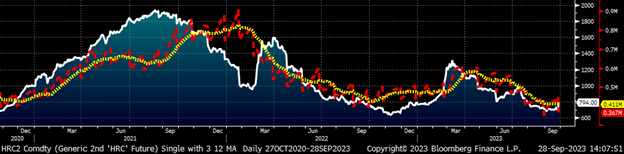
Despite all of this uncertainty, open interest, or the number of outstanding futures contracts, or tons in this case, across a product’s curve, remains near multi-year lows. Open interest fell to 367,000 tons Wednesday night following the expiration of the September future. Open interest climbed to an all-time high of 903,000 tons in January 2022. To me, current open interest tells us there is a relatively large number of unhedged physical tons at service centers.
Rolling 2nd Month CME HRC Future $/st & Open Interest (red) (22-day M.A. ylw)
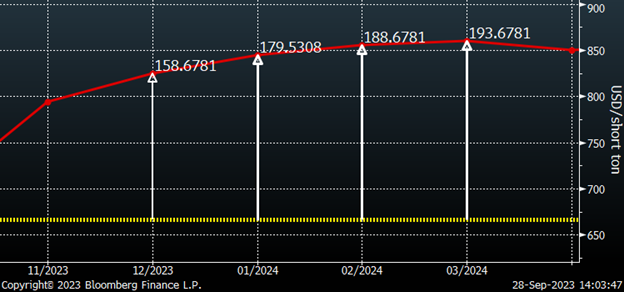
I find this baffling because of the price risk tied to the auto strike, but even more so because of the massive carry in the futures curve relative to physical spot. This chart compares this week’s $666 CRU print with the futures curve. The December future is $158 above this week’s CRU. January is $180, February $190, and March $195 above this week’s CRU. I don’t know what kind of profit margin your service center or trading company expects to earn, but a 27% margin seems a bit rich, making these futures extremely attractive as a hedge. Thus why the rally seen in response to the auto strike is even more surprising.
CME Hot Rolled Coil Futures Curve $/st
Since the UAW started taking action on Sept. 15, volume has picked up dramatically, as shown below.
October CME HRC Future $/st w Aggregate Curve Volume & 5-Day Avg. (yel)
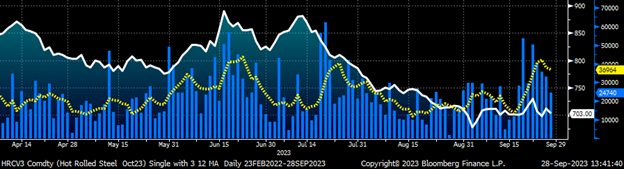
There was a flurry of buying that came into the market last week that was mostly focused on the November and December months. The relentless buyer or buyers attracted those looking to “roll” forward their short October positions. That means they would buy in their October short positions and simultaneously sell the November or December futures one for one. This is called a calendar spread. For a calendar spread to transact, both sides of the trade have to be executed simultaneously.
There was the relentless buyer of the November and December futures and then there were the parties interested in spreading October to November/December. All that was needed were sellers of the October future. As a result, the October future started to get bid up, first trading to $720, and then thousands of tons traded at $730 on Thursday and Friday.
If you do the math, that implies a CRU of around $800 by the last week of October. However, the spreaders didn’t care what they paid for the October future because they were spreading it forward to the tune of $50-70. This created an anomalous situation that allowed some players to step in and make an extremely favorable trade from a risk-reward standpoint. The upward pressure on the October future went away and it quickly fell back to as low as $689 on Tuesday. However, in the moment, there were some, myself included, wondering what was going on. What am I missing here?
I am comfortable admitting that I don’t know where prices will be in 60 or 90 days, let alone further out in time. Perhaps those buying the November and December futures last week will make a nice profit. Perhaps those locking in forward pricing in Q1 at $850 will prove to have made a wise decision. What surprises me is that we haven’t seen a surge of selling by service centers and importers to lock in abnormally large profits by purchasing physical HRC in the $600s and selling futures in the mid-$800s. You steel folks baffle me time and time again. What is funny to me is when physical players call hedging “just gambling.”
Keep an open mind about prices, my friends.


