

Analysis
February 21, 2024
US light-vehicle sales fall in January, still ahead y/y
Written by David Schollaert
US light-vehicle (LV) sales rose to an unadjusted 1.08 million units in January, up 2.8% vs. year-ago levels, the US Bureau of Economic Analysis (BEA) reported. Despite the year-on-year (y/y) boost, domestic LV sales were down 5.6% month on month (m/m).
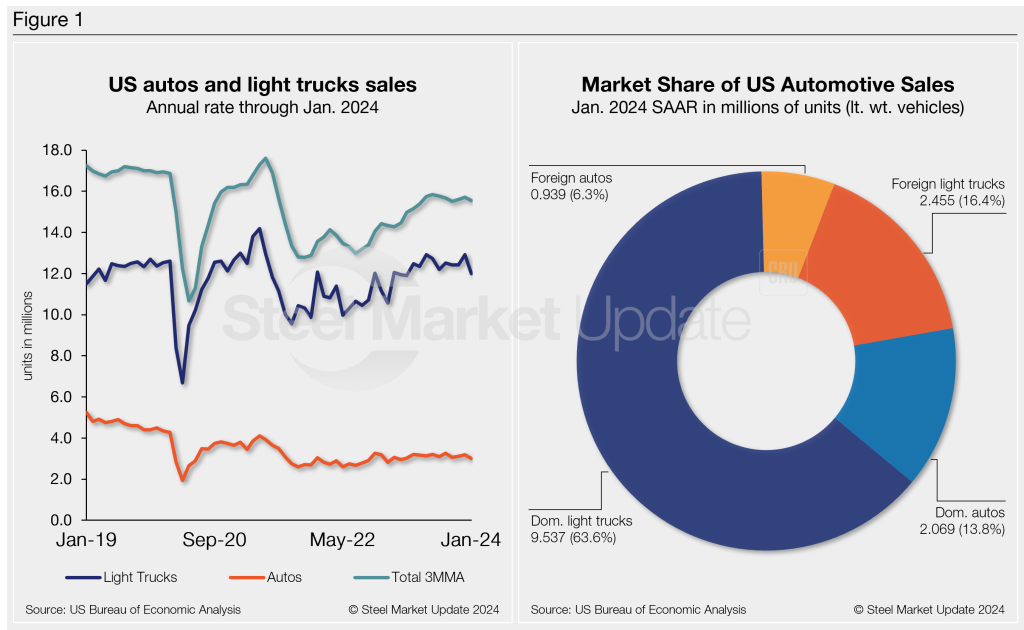
On an annualized basis, LV sales were 15 million units in January, down from 16.1 million units the month prior, and below the consensus forecast which called for a more modest decline to 15.7 million units.
Auto sales were likely impacted by a holiday splurge hangover and several winter storms across the Midwest and Northeast. High-priced inventory and higher financing rates continued to weigh on sales, though a recovery in incentive spending helped to support sales. And while production levels are roughly back at pre-pandemic levels, the average transaction price only fell by 2.4% in 2023.
The average daily selling rate (DSR) was 43,042 – calculated over 25 days – down from January 2023’s 43,622 daily rate. Passenger vehicle sales increased 1.4% y/y while sales of light trucks moved higher by 3.1% over the same period. Light trucks accounted for 80% of last month’s sales, roughly the same as its share of sales in January 2023.
Below in Figure 1 is the long-term picture of sales of autos and lightweight trucks in the US from 2019 through January 2024. Additionally, it includes the market share sales breakdown of last month’s 15 million vehicles at a seasonally adjusted annual rate.
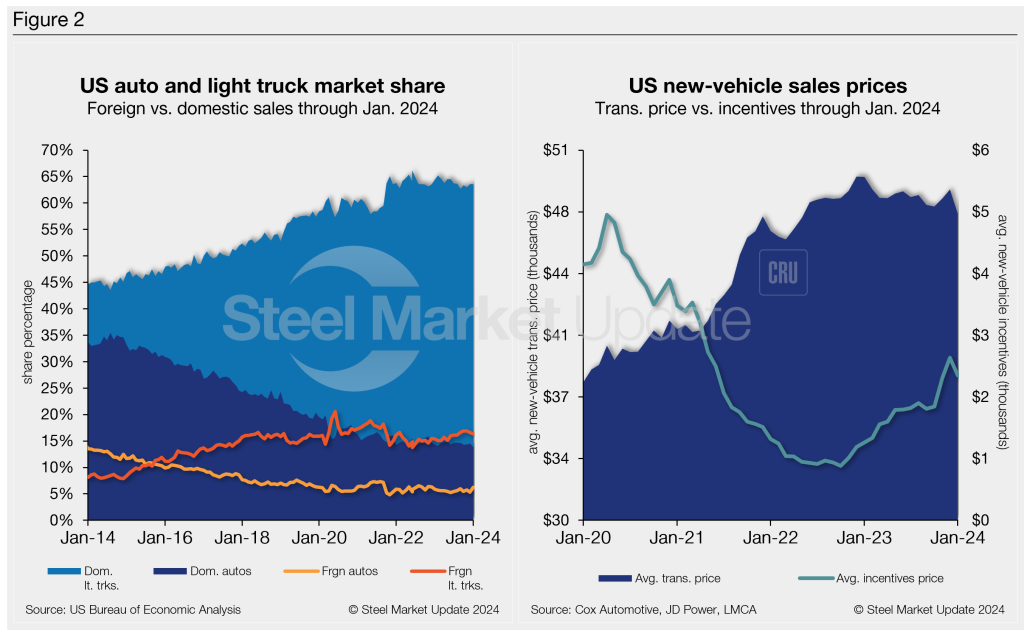
The new-vehicle average transaction price (ATP) was $47,401 in January, down 2.8% from December. Last month’s ATP was also 4.2% (-$2,067) below the year-ago period, according to Cox Automotive data.
Incentives decreased for the first time in four months. Last month’s incentives were $2,346, down 10.9% from December’s 31-month high of $2,633. With the m/m decrease, incentives are nearly 5% of the average transaction price. Incentives are up 86%, or $1,086, y/y.
In January, the annualized selling rate of light trucks was 11.991 million units, down 7.2% vs. the prior month and down 0.5% y/y. Annualized auto selling rates saw similar dynamics, down 5.8% and 1.5% in the same comparisons.
Figure 2 details the US auto and light-truck market share since 2013 and the divergence between average transaction prices and incentives in the US market since 2020.
Editor’s Note: This report is based on data from the US Bureau of Economic Analysis (BEA), LMC Automotive, JD Power, and Cox Automotive for automotive sales in the US, Canada, and Mexico. Specifically, the report describes light vehicle sales in the US.


