

Market Data

March 7, 2024
Price gap between HRC and CRC continues to widen
Written by Brett Linton
The price premium cold-rolled coil (CRC) carries over hot-rolled coil (HRC) remains wide, according to our latest market check. Based on our steel price indices published Tuesday, the spread between these products is at the fifth-highest weekly level seen over the last 16 months.
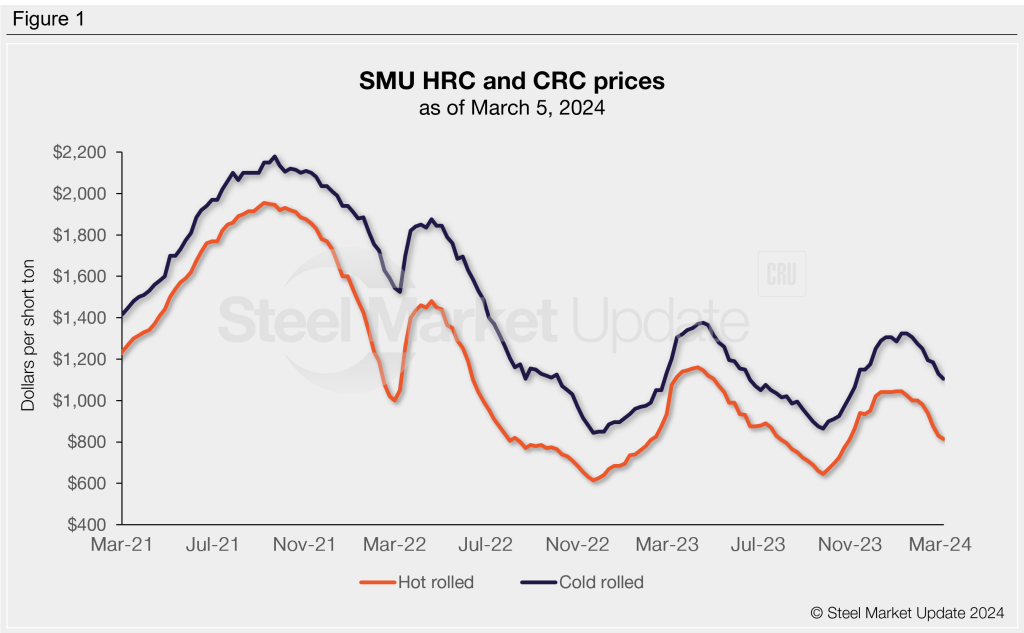
Figure 1 below shows SMU’s average HRC and CRC base prices as of March 5.
SMU’s average hot rolled price was $815/short ton this week, down $165 from one month prior. HRC prices are now $180/st lower than the highs seen at the start of the year, having fallen by an average of $26 each week of 2024.
Cold rolled prices eased to $1,105/st this week, down $145 compared to one month ago and $220 less than the mid-January peak. The average weekly decline in CRC prices in 2024 is slightly less than HRC at $20/st.
As Figure 2 shows, the latest HRC vs. CRC price spread is $290/st as of March 5, up $20 from early February. The average price spread throughout 2024 is now up to $283/st. Prior to the last few weeks, we have not seen spreads this high since Oct. 2022.
Recall that in early 2022, CRC’s premium over HRC peaked at $570/st, a record high. Throughout the second half of that year, the spread eased lower and returned to typical levels by year end. We saw relatively stable spreads throughout 2023, averaging $210/st across the year. In December, the delta began to widen again and has continued to do so since.
Are sub-$200/st premiums now a thing of the past? Over the past two-and-a-half years, we have only seen 12 weeks where the price spreads were beneath that threshold.
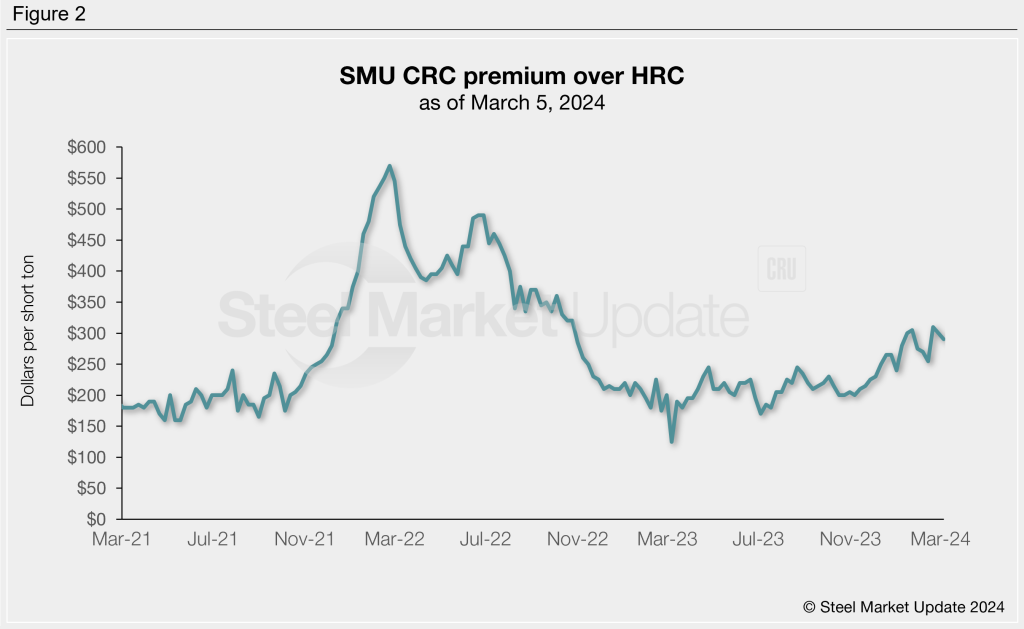
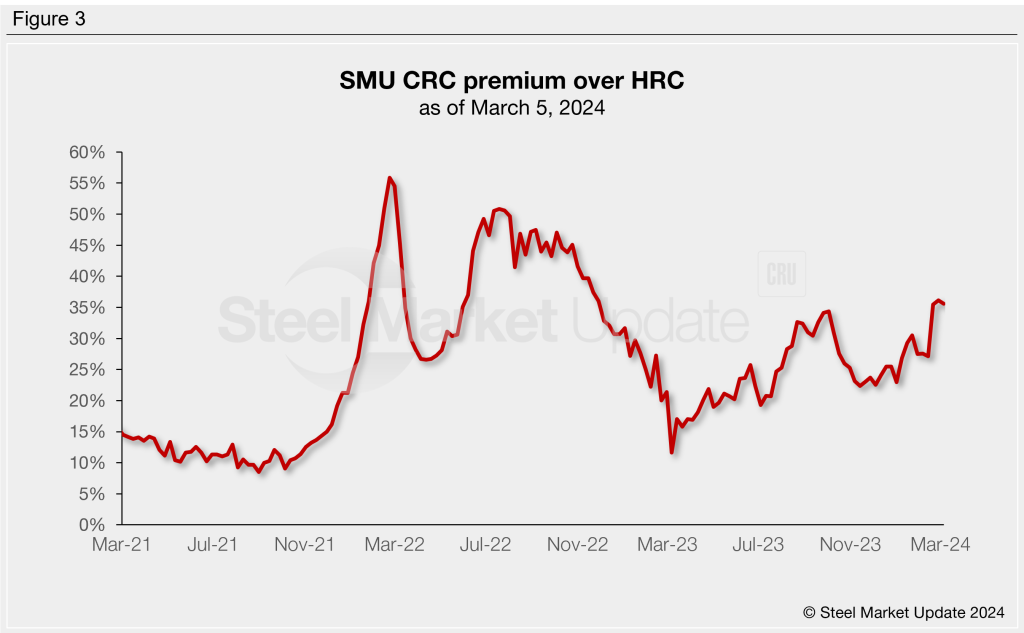
Figure 3 shows the spread from a different vantage point, graphing the cold rolled premium over hot rolled as a percentage of the HRC price.
While CRC’s percentage premium over HRC took a dive in late 2022, the premium recovered throughout 2023, peaking at 34% in October. After briefly easing through the final months of last year, the spread jumped back up in February and now stands at a 16-month high of 36%.
You can chart historical steel prices and more using SMU’s interactive pricing tool on our website.


