Market Data
May 15, 2024
April service center shipments and inventories report
Written by Estelle Tran
Steel Market Update is pleased to share this Premium content with Executive members. For information on how to upgrade to a Premium-level subscription, contact info@steelmarketupdate.com.
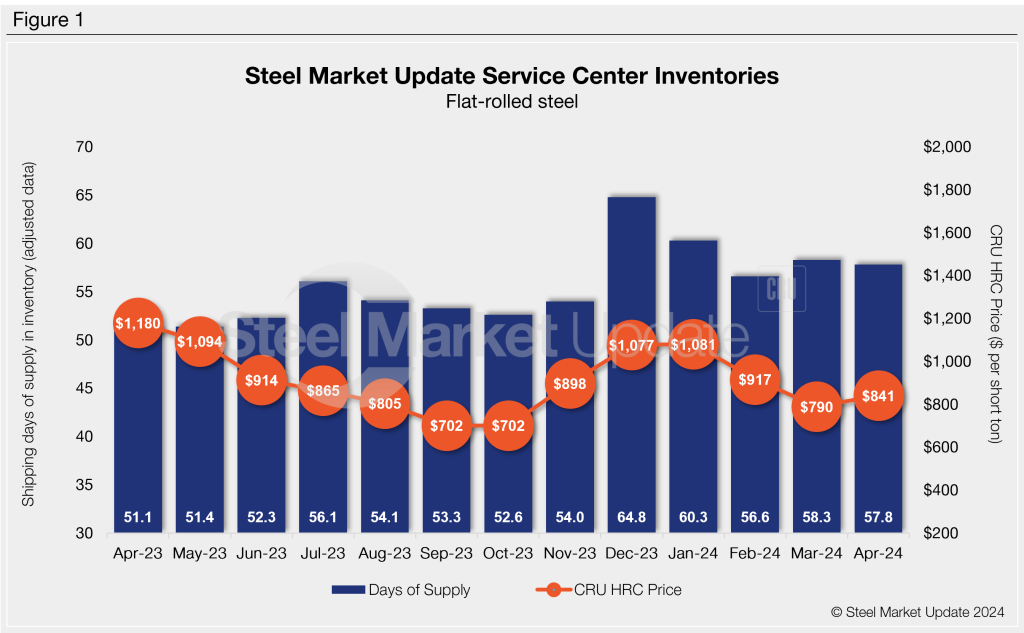
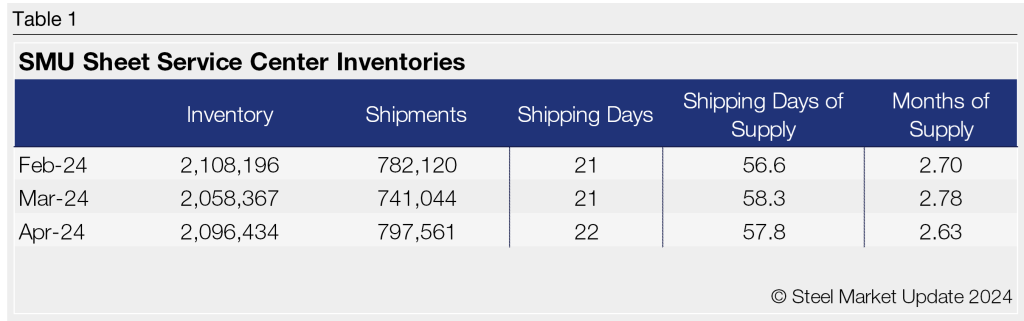
Flat Rolled = 57.8 shipping days of supply
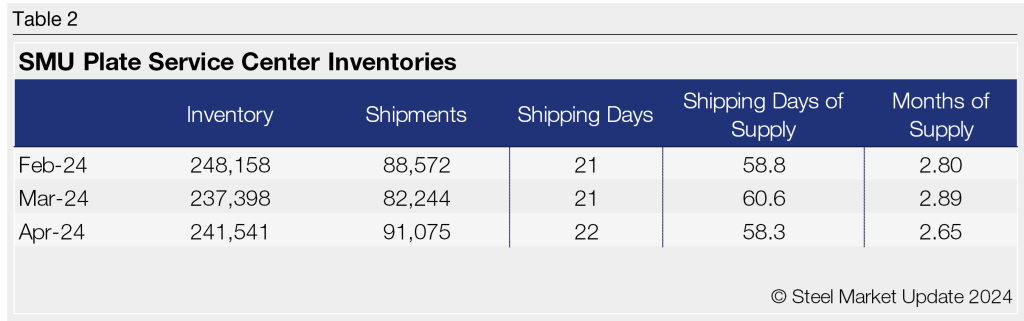
Plate = 58.3 shipping days of supply
Flat Rolled
US service center flat-rolled steel supply edged lower in April, though shipments continue to lag behind 2023 levels. At the end of April, service centers carried 57.8 shipping days of supply on an adjusted basis, down from 58.3 shipping days in March. In terms of months on hand, service centers held 2.63 months of flat-rolled steel supply at the end of April, down from 2.78 months in March.
April had 22 shipping days, while March had 21. For the fifth consecutive month of the year, the flat roll daily shipping rate trailed behind 2023 levels. Intake at service centers swelled in April with steady – but not strong – shipments.
The latest SMU survey with data through May 8th reported that 50% of manufacturers were buying less flat-rolled steel compared to one year ago. The survey found 32% were buying the same amount and 18% were purchasing more. At the same time, 46% of service centers said customer releases were down compared to one year ago, 50% were shipping the same amount, and 4% were shipping more products.
Material on order fell in April to represent 38.8 shipping days of supply, down from 43.3 shipping days in March. Flat-rolled steel on order represented 67.2% of inventory, down from 74.2% in March. The drop in material on order coincided with a decline in sheet prices as well as a contraction in mill lead times. The latest SMU survey reported hot-rolled coil lead times at 4.92 weeks, down from 5.3 weeks the month before.
Flat-rolled steel inventories were bloated in April because of lackluster outbound shipments from service centers, but in May, inventories are poised to be in better balance with demand, partly because of the drop in material on order.
Plate
Plate supply at US service centers followed a similar trend as sheet in April, as shipments remained mostly weak. At the end of April, service centers carried 58.3 shipping days of plate supply, down from 60.6 shipping days of supply in March. Plate inventories represented 2.65 months of plate supply in April, down from 2.89 months in March.
Service center contacts have said that they have not seen the typical seasonal uptick in demand, which has put downward pressure on prices. This also caused a boost in plate intake in April. Plate mill lead times shortened in the May 8th survey to 5.5 weeks from 5.92 weeks a month ago.
With short mill lead times and bearish outlooks on plate pricing and demand, the amount of plate on order in April fell to the lowest point since October 2023. In terms of supply, the material on order in April represented 33.7 shipping days of supply, down from 43.6 shipping days in March. The 33.7 shipping days of supply on order was the lowest level since October 2020. Plate on order at the end of April represented 57.7% of inventory, down from 72% in March.
The drop-off in plate on order and lower plate supply in April indicate more balanced supply relative to demand in May, with the ongoing demand weakness.