

Market Data
March 15, 2024
SMU Steel Demand Index recovers to a four-month high
Written by David Schollaert
Steel Market Update’s Steel Demand Index recovered out of contraction territory on the heels of the pricing blitz from mills last week, according to our latest survey data.
The move into growth comes after the index had remained in contraction territory for the better part of the past two months. The latest developments come as prices and lead times were overall flat, even as sheet buyers continue to find some mills are still willing to talk price.
Lead times were largely sideways, holding just below 5 weeks, while hot-rolled coil is still on average $815 per short ton (st).
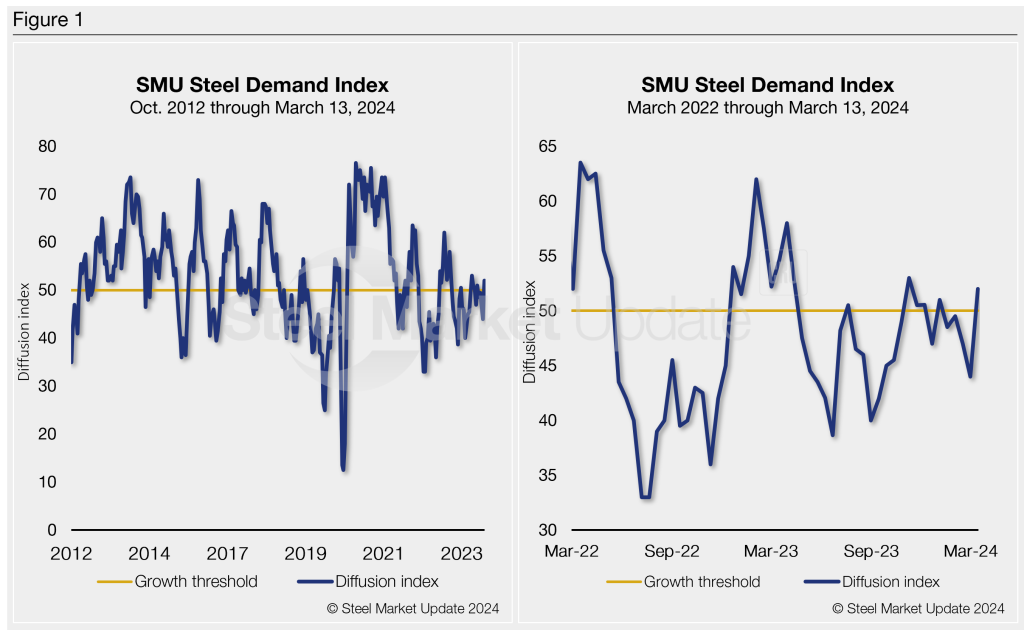
SMU’s Steel Demand Index now stands at 52, up eight points from a reading of 44 at the end of February. The bounce comes after the index had reached its lowest measure since late December.
In recent months, the measure had improved by more than 13 points back on Nov. 9, staying in expansion territory until late December. The latest reading pushes the index into growth territory for the first time since the first week of January and is the highest measure since Nov. 9.
There is a bit of a cautionary tale in the latest gain. The only time the index has moved into growth territory since late-April 2023 has been for short-lived bumps when the market responded to mill price hikes in mid-June, late September, and November.
And here we are again – mills have set new base price targets, stopping the downward momentum, and drawing buying interest. Demand appears to have responded, but it’s too early to tell if it will last.
It’s important to note that SMU’s Steel Demand Index has been largely trending downwards and in contraction territory for nearly a year.
Methodology
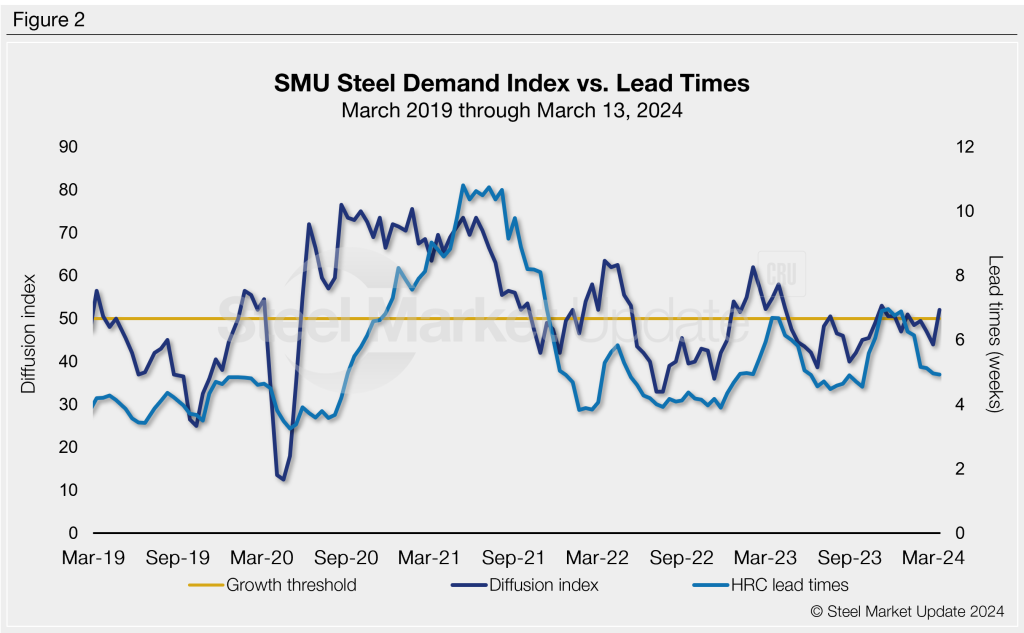
The index, which compares lead times and demand, is a diffusion index derived from the market surveys we conduct every two weeks. This index has historically preceded lead times, which is notable given that lead times are often seen as a leading indicator of steel price moves.
An index score above 50 indicates rising demand and a score below 50 suggests declining demand. Detailed side by side in Figure 1 are both the historical views and the latest Steel Demand Index.
Current state of play
While we haven’t seen much from hot rolled prices or lead times this week – both are in what appears to be a holding pattern. We’ve heard that buyers were keen to secure “pre-announcement” volumes.
There were also some service centers covering inventory gaps after buying little since October.
That boost in buying, coinciding with some mill sales, may have filled order books through Q2. Add in planned outages from March through June, and that might be all mills need to see prices turn.
SMU’s latest check of the market on March 12 placed HRC at an average of $$815/st FOB mill, east of the Rockies, flat vs. the prior week. Hot band is now down $230/st since recently peaking at $1,045/st in early January.
And lead times have still been pointing down as well for much of the past two months. Lead times edged down just a bit, 4.93 weeks vs. 4.96 weeks at the end of February.
Ultimately, prices and lead times might have bottomed and about to inflect up, highlighted by the boost in our demand index. But it’s too early to tell.
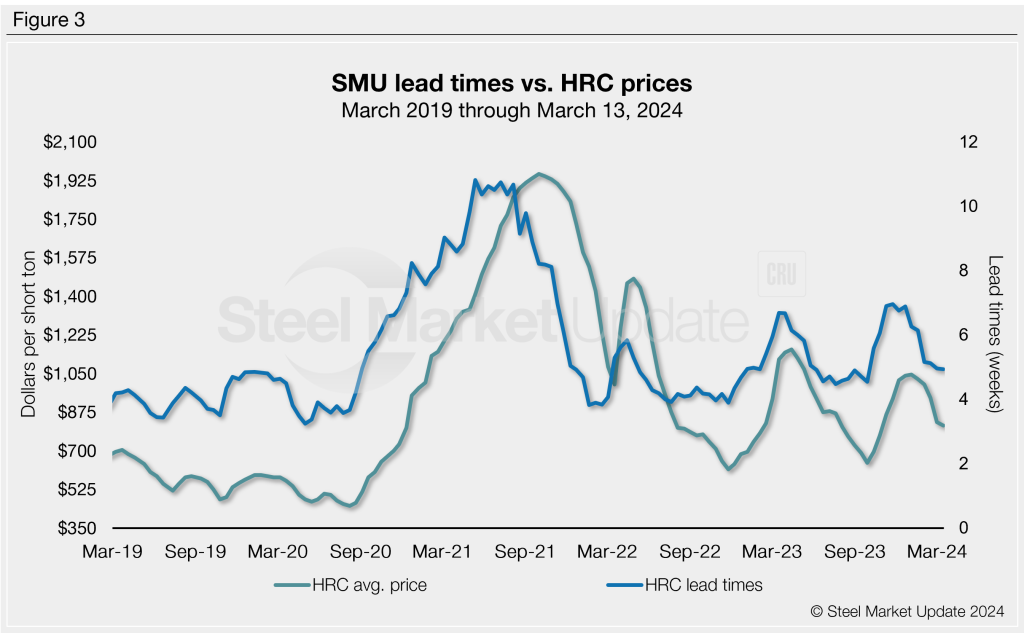
It’s important to note that SMU’s demand diffusion index has, for nearly a decade, preceded moves in steel mill lead times (Figure 2), and SMU’s lead times have also been a leading indicator for flat-rolled steel prices, particularly HRC (Figure 3).
What to watch for
Keep an eye out for widening lead times and another round of price hikes from mills. If the added buying and gap covering seen from the mill announcements indeed improved order books, lead times will stretch a bit giving precedence for another round of price increases.
While hot-rolled coil lead times are still below five weeks on average and pointing lower, maintenance outages coupled with recent buying could push lead times out and boost pricing. It’s too early to tell how it will all shake out, but it will be interesting to see how underlying demand moves as we close in on Q2.
Note: Demand, lead times, and prices are based on the average data from manufacturers and steel service centers that participate in SMU’s market trends analysis surveys. Our demand and lead times do not predict prices but are leading indicators of overall market dynamics and potential pricing dynamics. Look to your mill rep for actual lead times and prices.


