

Market Data

May 21, 2024
SMU price ranges: Continued declines across the board
Written by Brett Linton
Steel prices eased for both sheet and plate products this week, according to our latest canvass of the market. Sheet prices declined an average of $19 per short ton (st) compared to last week, now near seven-month lows. Our plate index fell $30 from one week prior, easing to a three-year low.
Multiple sources remarked that the market is slow and not a lot of activity is happening; one executive commented it is “kinda boring.” It appears the summer doldrums have arrived a little earlier this year.
When might we see a bottom? There is speculation that mills will try to hold the line in June, possibly rolling out price increases in the near future as an attempt to stop the bleeding. Some buyers expect prices to stabilize in the coming weeks and reverse course in June. Others believe weak economic conditions and soft demand will allow prices to slide further.
SMU price momentum indicators for both sheet and plate continue to point to lower prices.
Hot-rolled coil
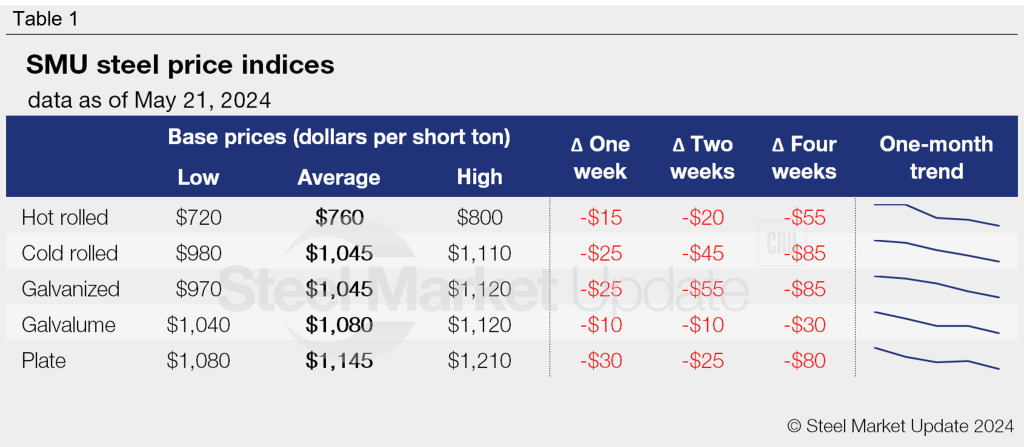
The SMU price range is $720-800/st, averaging $760/st FOB mill, east of the Rockies. The lower end of our range is down $5/st week over week (w/w), while the top end is down $25/st. Our overall average is down $15/st w/w. Our price momentum indicator for HR remains at lower, meaning we expect prices to decline over the next 30 days.
Hot rolled lead times range from 3-7 weeks, averaging 4.9 weeks as of our May 8 market survey.
Cold-rolled coil
The SMU price range is $980–1,110/st, averaging $1,045/st FOB mill, east of the Rockies. The lower end of our range is down $30/st w/w, while the top end is down $20/st. Our overall average is down $25/st w/w. Our price momentum indicator for CR remains at lower, meaning we expect prices to decline over the next 30 days.
Cold rolled lead times range from 5-9 weeks, averaging 7.2 weeks through our latest survey.
Galvanized coil
The SMU price range is $970–1,120/st, averaging $1,045/st FOB mill, east of the Rockies. The lower end of our range is down $30/st w/w, while the top end is down $20/st. Our overall average is down $25/st w/w. Our price momentum indicator for galvanized remains at lower, meaning we expect prices to decline over the next 30 days.
Galvanized .060” G90 benchmark: SMU price range is $1,067–1,217/st, averaging $1,142/st FOB mill, east of the Rockies.
Galvanized lead times range from 5-9 weeks, averaging 7.1 weeks through our latest survey.
Galvalume coil
The SMU price range is $1,040–1,120/st, averaging $1,080/st FOB mill, east of the Rockies. The lower end of our range is unchanged w/w, while the top end is down $20/st. Our overall average is down $10/st w/w. Our price momentum indicator for Galvalume remains at lower, meaning we expect prices to decline over the next 30 days.
Galvalume .0142” AZ50, grade 80 benchmark: SMU price range is $1,334–1,414/st, averaging $1,374/st FOB mill, east of the Rockies.
Galvalume lead times range from 6-10 weeks, averaging 7.7 weeks through our latest survey.
Plate
The SMU price range is $1,080–1,210/st, averaging $1,145/st FOB mill. The lower end of our range is down $65/st w/w, while the top end is up $5/st. Our overall average is down $30/st w/w. Our price momentum indicator for plate remains at lower, meaning we expect prices to decline over the next 30 days.
Plate lead times range from 4-7 weeks, averaging 5.5 weeks through our latest survey.
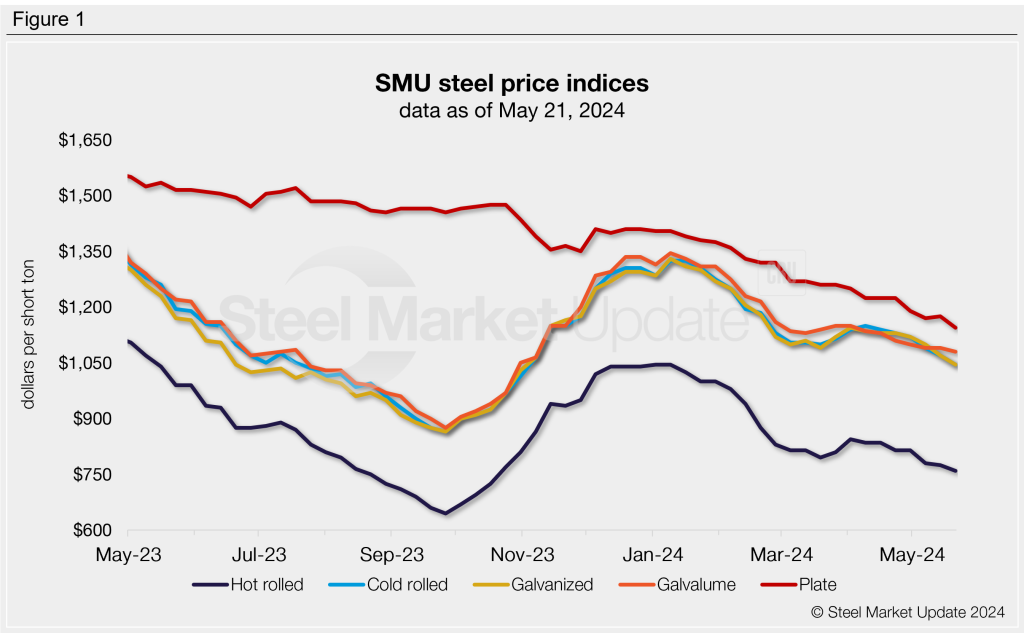
SMU note: Above is a graphic showing our hot rolled, cold rolled, galvanized, Galvalume, and plate price history. This data is also available here on our website with our interactive pricing tool. If you need help navigating the website or need to know your login information, contact us at info@steelmarketupdate.com.


