Prices

June 1, 2017
Hot Rolled Futures: Dip in Sight as Indexes Break Below $600/st...
Written by David Feldstein
The following article on the hot rolled coil (HRC) futures markets was written by David Feldstein. As the Flack Global Metals director of risk management, Dave is an active participant in the hot rolled coil (HRC) futures market and we believe he will provide insightful commentary and trading ideas to our readers. Besides writing futures articles for Steel Market Update, Dave produces articles that our readers may find interesting under the heading “The Feldstein” on the Flack Global Metals website www.FlackGlobalMetals.com.
No product has more breakneck volatility, kurtosis and downright risk than Midwest HRC physical and futures prices. Historically, Midwest HRC prices trend hard and fast in one direction and then sit or sleep for a while. So has the metaphorical Midwest HRC volatitily Godzilla awoken from his recent slumber to once again wreak havoc on the U.S. steel industry?


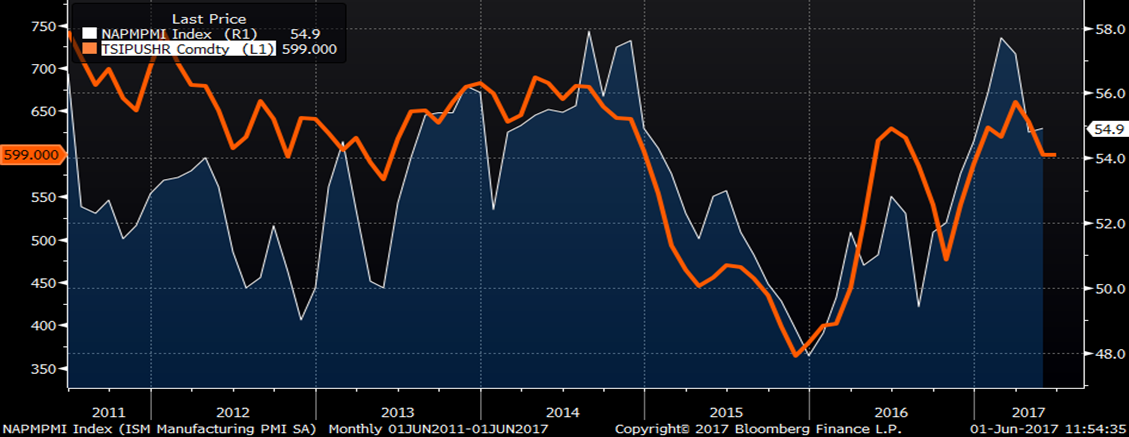
Fundamentals are too strong! Today’s ISM Manufacturing PMI increased 0.1 to 54.9. This was a decent number and not indicative of a collapsing manufacturing industry, especially considering recent weakness in auto sales. This chart shows how well correlated the ISM PMI is with Midwest HRC prices.
ISM Vs. TSI Daily Midwest HRC
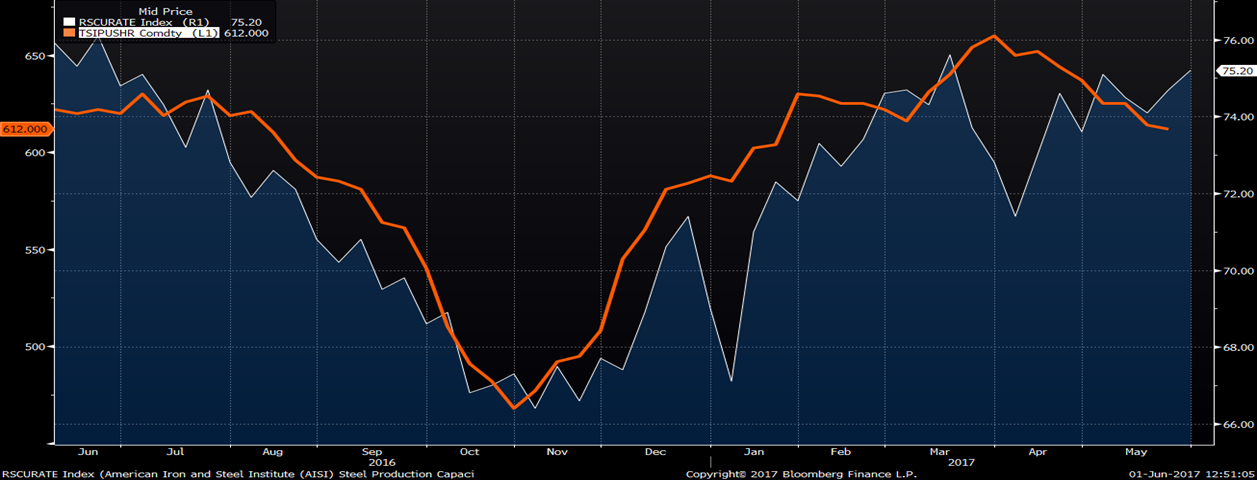
AISI Capacity Utilization is another statistic that correlates well with the Midwest HRC price. Capacity utilization has rebounded nicely as prices have fallen over the past few weeks. In fact, this week’s 75.2% print is the highest since 75.6% on March 17th, 2017 and 76.1% on June 17th, 2016. HRC prices were $640/st and $622/st, respectively on those dates.
AISI Capacity Utilization Vs. TSI Daily Midwest HRC
The chart below of June CME Midwest HRC futures has made higher highs and higher lows (Dow Theory) while holding the uptrend since prices bottomed in February, 2016. This is an interesting area, for if it holds trend, then it will have proved to have been a fantastic buy the dips buying opportunity. However, if prices break below trend, proceed with caution.
June CME Midwest HRC Futures & Curve
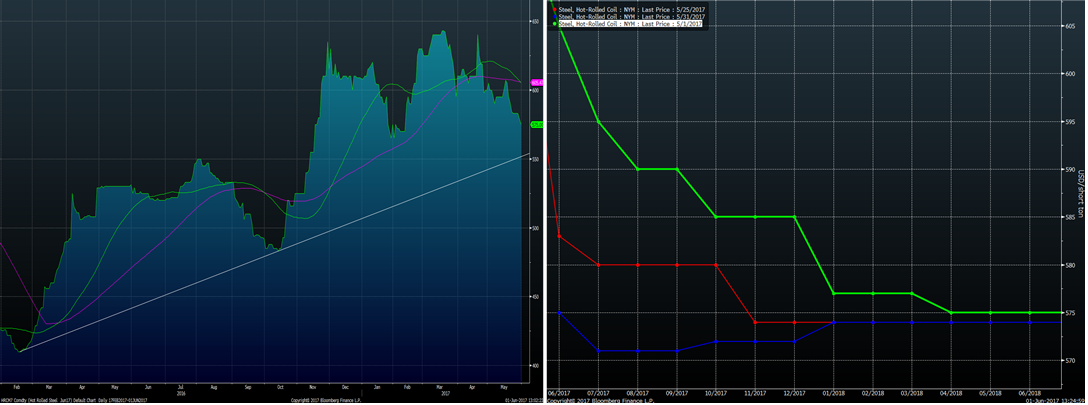
The conservative play would be to wait and see if it bounces off this area, but you risk missing out as HRC futures tend to gap around pivot points. Remember…
“You can’t lose what you don’t put in the middle……

…but you can’t win much either.”
China’s May Caixan Manufacturing PMI slipped below 50 to 49.6, an eleven month low, while the official PMI was flat at 51.2. The Caixan PMI is more focused on small and medium sized private manufacturing firms whereas the official PMI is more heavily weighted toward larger S.O.E.s or State Owned Enterprises.
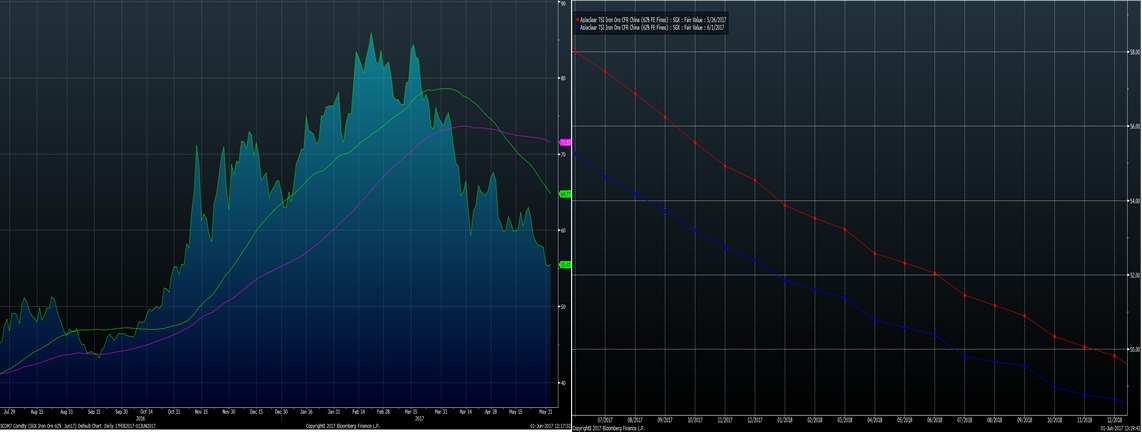
With iron ore inventory at Chinese ports making new all-time highs, iron ore prices have broken below the support level discussed last time the two of us got together. China is a very tricky trade as much of the time good news is bad news and bad news is good news with respect to government policy. How will the government react to the recent spate of weaker than expected economic data? If the answer is injecting liquidity into the financial system and relaxing recent restrictions in the property market, then it might breed new life into property development and thus ore and Chinese steel prices. Don’t forget about the 19th National Congress of the Communist Party of China to be held in November.
June SGX Iron Ore Futures & Curve
Technical Corner
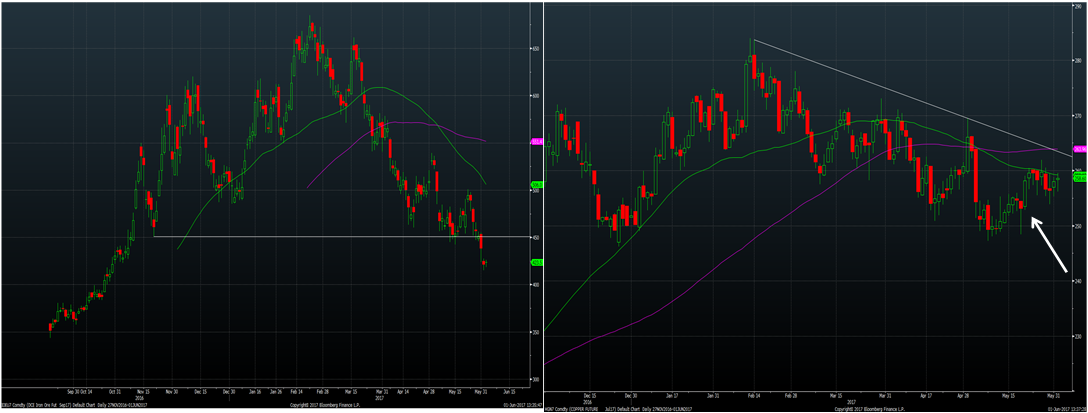
Two weeks ago, the interesting price action in the Dalian iron ore futures and CME copper futures was discussed. On that Thursday, both products sold off aggressively early in the day and then rebounded into the close. This type of intraday price action is sometimes indicative of a trend reversal or bottom. In the case of iron ore, prices eventually dropped below the 450 yuan support level, a very bearish sign. However, copper rallied almost $5 the day after the “hammer,” a very strong signal that the bottom may be in (see white arrow). Copper has since traded in the 2.55 – 2.60 range. Since both products are considered bellwethers for Chinese economics, it is hard to make much of a conclusion here other than technical analysis is only half of the work that needs to be done. The other 90 percent is mostly fundamental.
Sept. Dalian Iron Ore Future and July CME Copper Futures
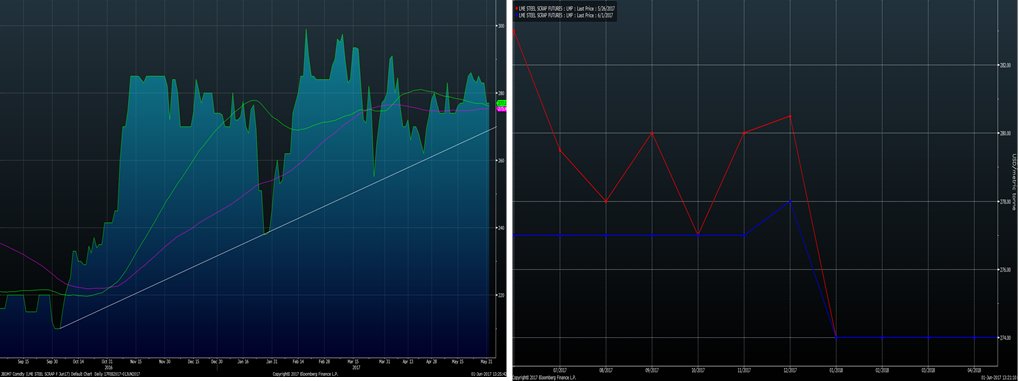
LME Turkish scrap has been holding up nicely in the high $270s, remaining above its bullish trendline.
June LME Turkish Scrap & Curve
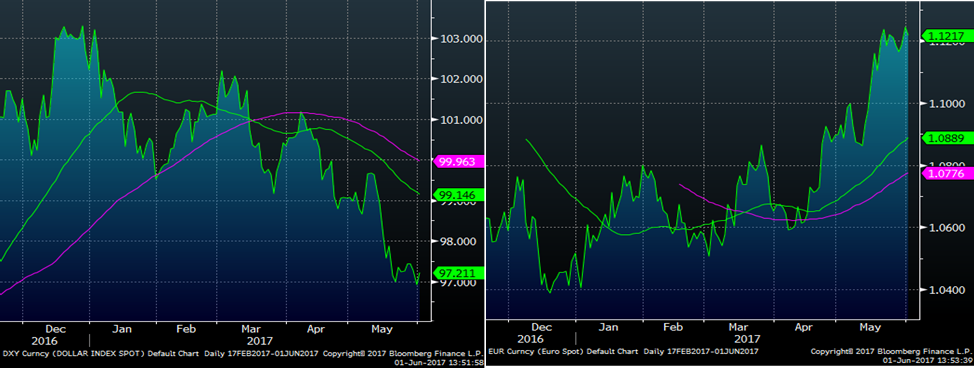
One last point…the US dollar index and euro have made major moves in the past six weeks. A weaker dollar has historically been a boon for commodity prices.
US Dollar Index & Euro
So is it time to buy the dips? HRC futures have finally started to move lower trading around $570. In fact, some large futures buyers have shown up at $570, so it will be interesting to see what happens with those trades. Still, the answer is close, but not yet. However, if prices fall into the $550s – 560s, barring a severe shock, then buy the dips!
The opportunity might present itself in HRC futures at any time, so pay close attention. Keep your local broker on speed dial and remember…
“Life moves pretty fast. If you don’t stop and take a look around once in a while, you could miss it.” – Ferrous Bueller