

Market Data
December 21, 2023
SMU Steel Demand Index slumps to close out 2023
Written by David Schollaert
Steel Market Update’s Steel Demand Index declined, falling back into contraction territory after a very short-lived gain just two weeks ago, according to our latest survey data.
The latest developments come as mill price increases appear to be running out of steam and tags plateauing. But not all the data points are moving in the same direction – not surprising given the approaching year-end holiday slowdown.
Lead times have edged up a bit after declining two weeks ago for the first time since September, and while some mills are still seeking $1,100 per ton, deals in the $900s per ton have been reported.
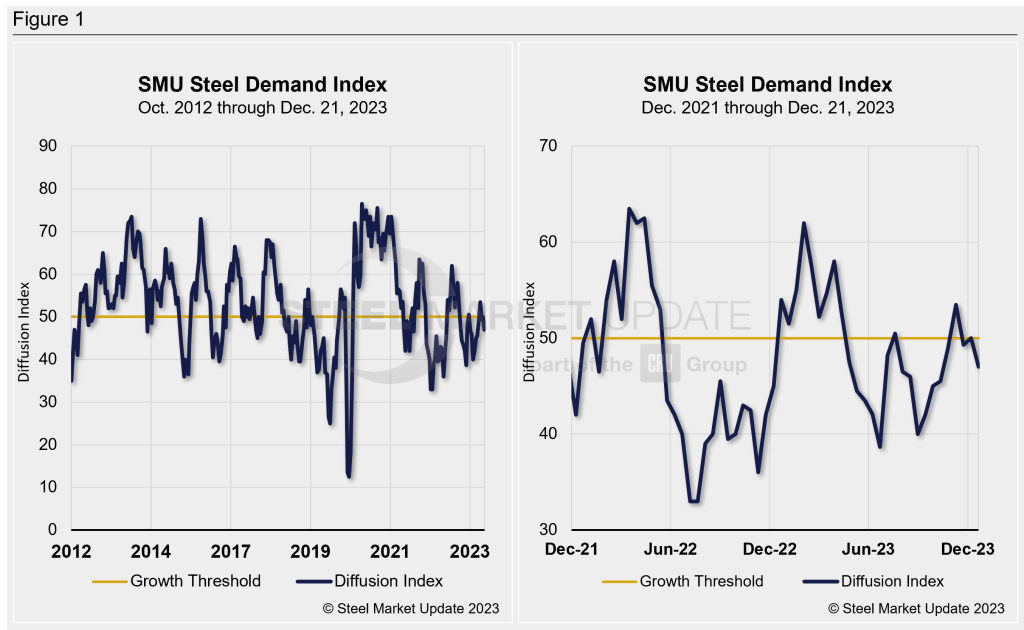
SMU’s Steel Demand Index now stands at 47, down 3 points from a reading of 50 at the beginning of December. The measure is the lowest it’s been in over two months, and back in contracting territory, a level it’s been for the better part of the year.
The measure had improved by more than 13 points back on Nov. 9 after reaching a recent low of 40 back in late August. Of note, the only time the index has moved into growth territory since late April has been for short-lived bumps when the market responded to mill price hikes in mid-June and late September.
SMU’s Steel Demand Index has been largely trending downwards and in contraction territory since early April.
Methodology
The index, which compares lead times and demand, is a diffusion index derived from the market surveys we conduct every two weeks. This index has historically preceded lead times, which is notable given that lead times are often seen as a leading indicator of steel price moves.
An index score above 50 indicates rising demand and a score below 50 suggests declining demand. Detailed side by side in Figure 1 are both the historical views and the latest Steel Demand Index.
Current state of play
While overall market sentiment is still somewhat bullish, especially when looking at 2024, more buyer resistance, and a slightly improved reading in mills willingness to negotiate lower prices are at odds with higher input costs.
SMU’s latest check of the market on Dec. 19 placed HRC at an average of $1,040 per ton FOB mill, east of the Rockies, unchanged vs. the prior week. While hot band is now up nearly $400 per ton since reaching the recent low of $645 per ton in late September, its gains may have stagnated.
With 2024 buying underway, and reports of some order book holes in January, buyers seem unwilling to add build inventory until the new year. The result: it’s no surprise that our demand index has declined as we approach the end of December.
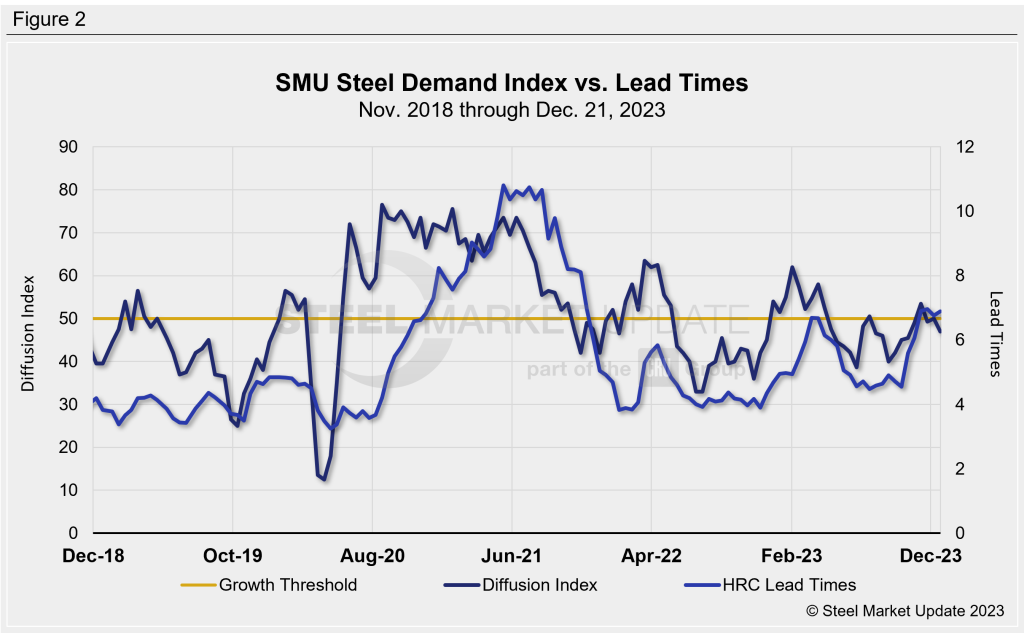
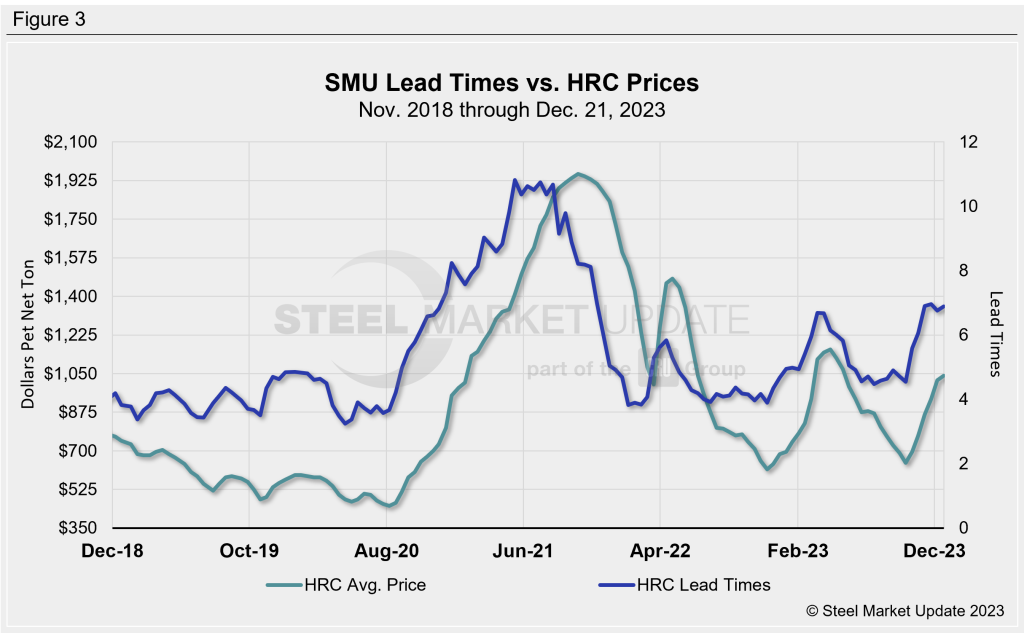
It important to note that SMU’s demand diffusion index has, for nearly a decade, preceded moves in steel mill lead times (Figure 2), and SMU’s lead times have also been a leading indicator for flat-rolled steel prices, particularly HRC (Figure 3).
What to watch for
I’m afraid to say it, but it’s still lead times. They pushed out in SMU’s latest survey results. Our hot rolled lead times are presently averaging approximately 6.89 weeks, up from 6.76 weeks in early December. While they are still a bit below this year’s high of 6.96 weeks, they’re not far off. But with the price rally appearing to be running out of steam, will lead times follow and begin to move in over the coming weeks, or will longer lead times provide support to a new round of price increases come January?
Note: Demand, lead times, and prices are based on the average data from manufacturers and steel service centers that participate in SMU’s market trends analysis surveys. Our demand and lead times do not predict prices but are leading indicators of overall market dynamics and potential pricing dynamics. Look to your mill rep for actual lead times and prices.


