

Market Data
February 21, 2024
SMU Steel Demand Index sags, hits four-month low
Written by David Schollaert
Steel Market Update’s Steel Demand Index has moved lower, having remained in contraction territory for the better part of the past two months, according to our latest survey data.
The latest developments come as prices and lead times have declined further and sheet buyers continue to find mills willing to talk price.
Lead times have edged down to roughly 5 weeks, while hot-rolled coil is now on average below the $900-per-short-ton (st) mark.
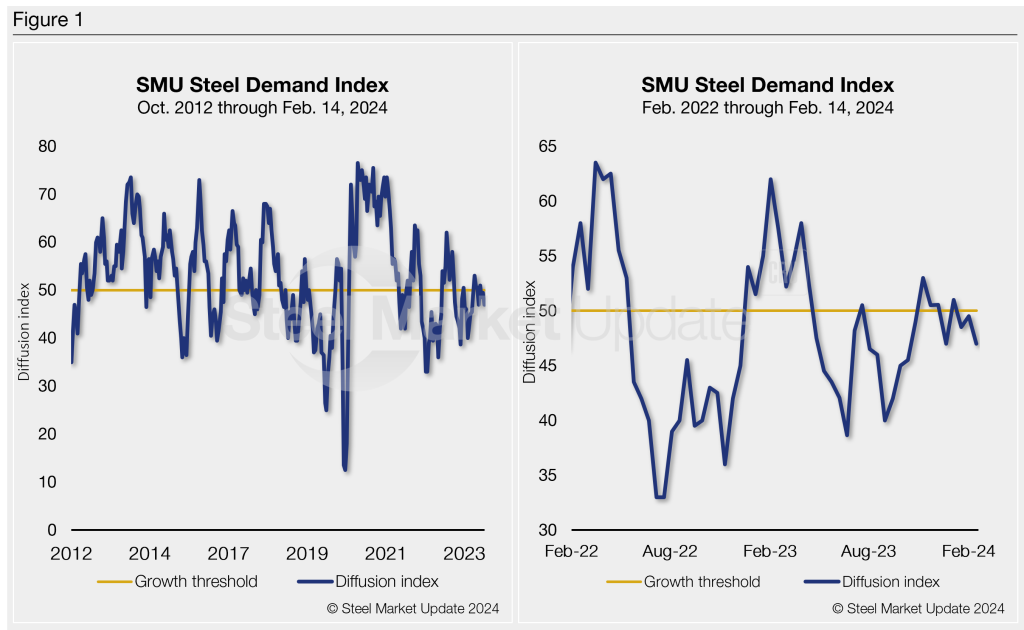
SMU’s Steel Demand Index now stands at 47, down 2.5 points from a reading of 49.5 at the beginning of February. The measure is the lowest it’s been since late December, still in contracting territory, a level it’s been in for the better part of the past ten months.
The measure had improved by more than 13 points back on Nov. 9, staying in expansion territory until late December. Of note, the only time the index has moved into growth territory since late-April 2023 has been for short-lived bumps when the market responded to mill price hikes in mid-June, late September, and November.
SMU’s Steel Demand Index has been largely trending downwards and in contraction territory since early April.
Methodology
The index, which compares lead times and demand, is a diffusion index derived from the market surveys we conduct every two weeks. This index has historically preceded lead times, which is notable given that lead times are often seen as a leading indicator of steel price moves.
An index score above 50 indicates rising demand and a score below 50 suggests declining demand. Detailed side by side in Figure 1 are both the historical views and the latest Steel Demand Index.
Current state of play
While overall market sentiment is steady – hovering around an average reading of 65 for the better part of a couple of months – buyer resistance, tighter lead times, lower scrap prices, and improved reading in mills’ willingness to negotiate lower prices point to tags trending down further.
SMU’s latest check of the market on Feb. 20 placed HRC at an average of $$875/st FOB mill, east of the Rockies, down $65/st vs. the prior week. Hot band is now down $170/st since recently peaking at $1,045/st in early January.
And lead times have still been pointing down as well for much of the past two months. Lead times edged down a bit to 5.13 weeks vs. 5.16 weeks in early February.
As we move into the second half of Q1’24, buying has not been as strong as many anticipated and buyers seem unwilling to build inventory. The result: it’s no surprise that our demand index has declined as we approach March.
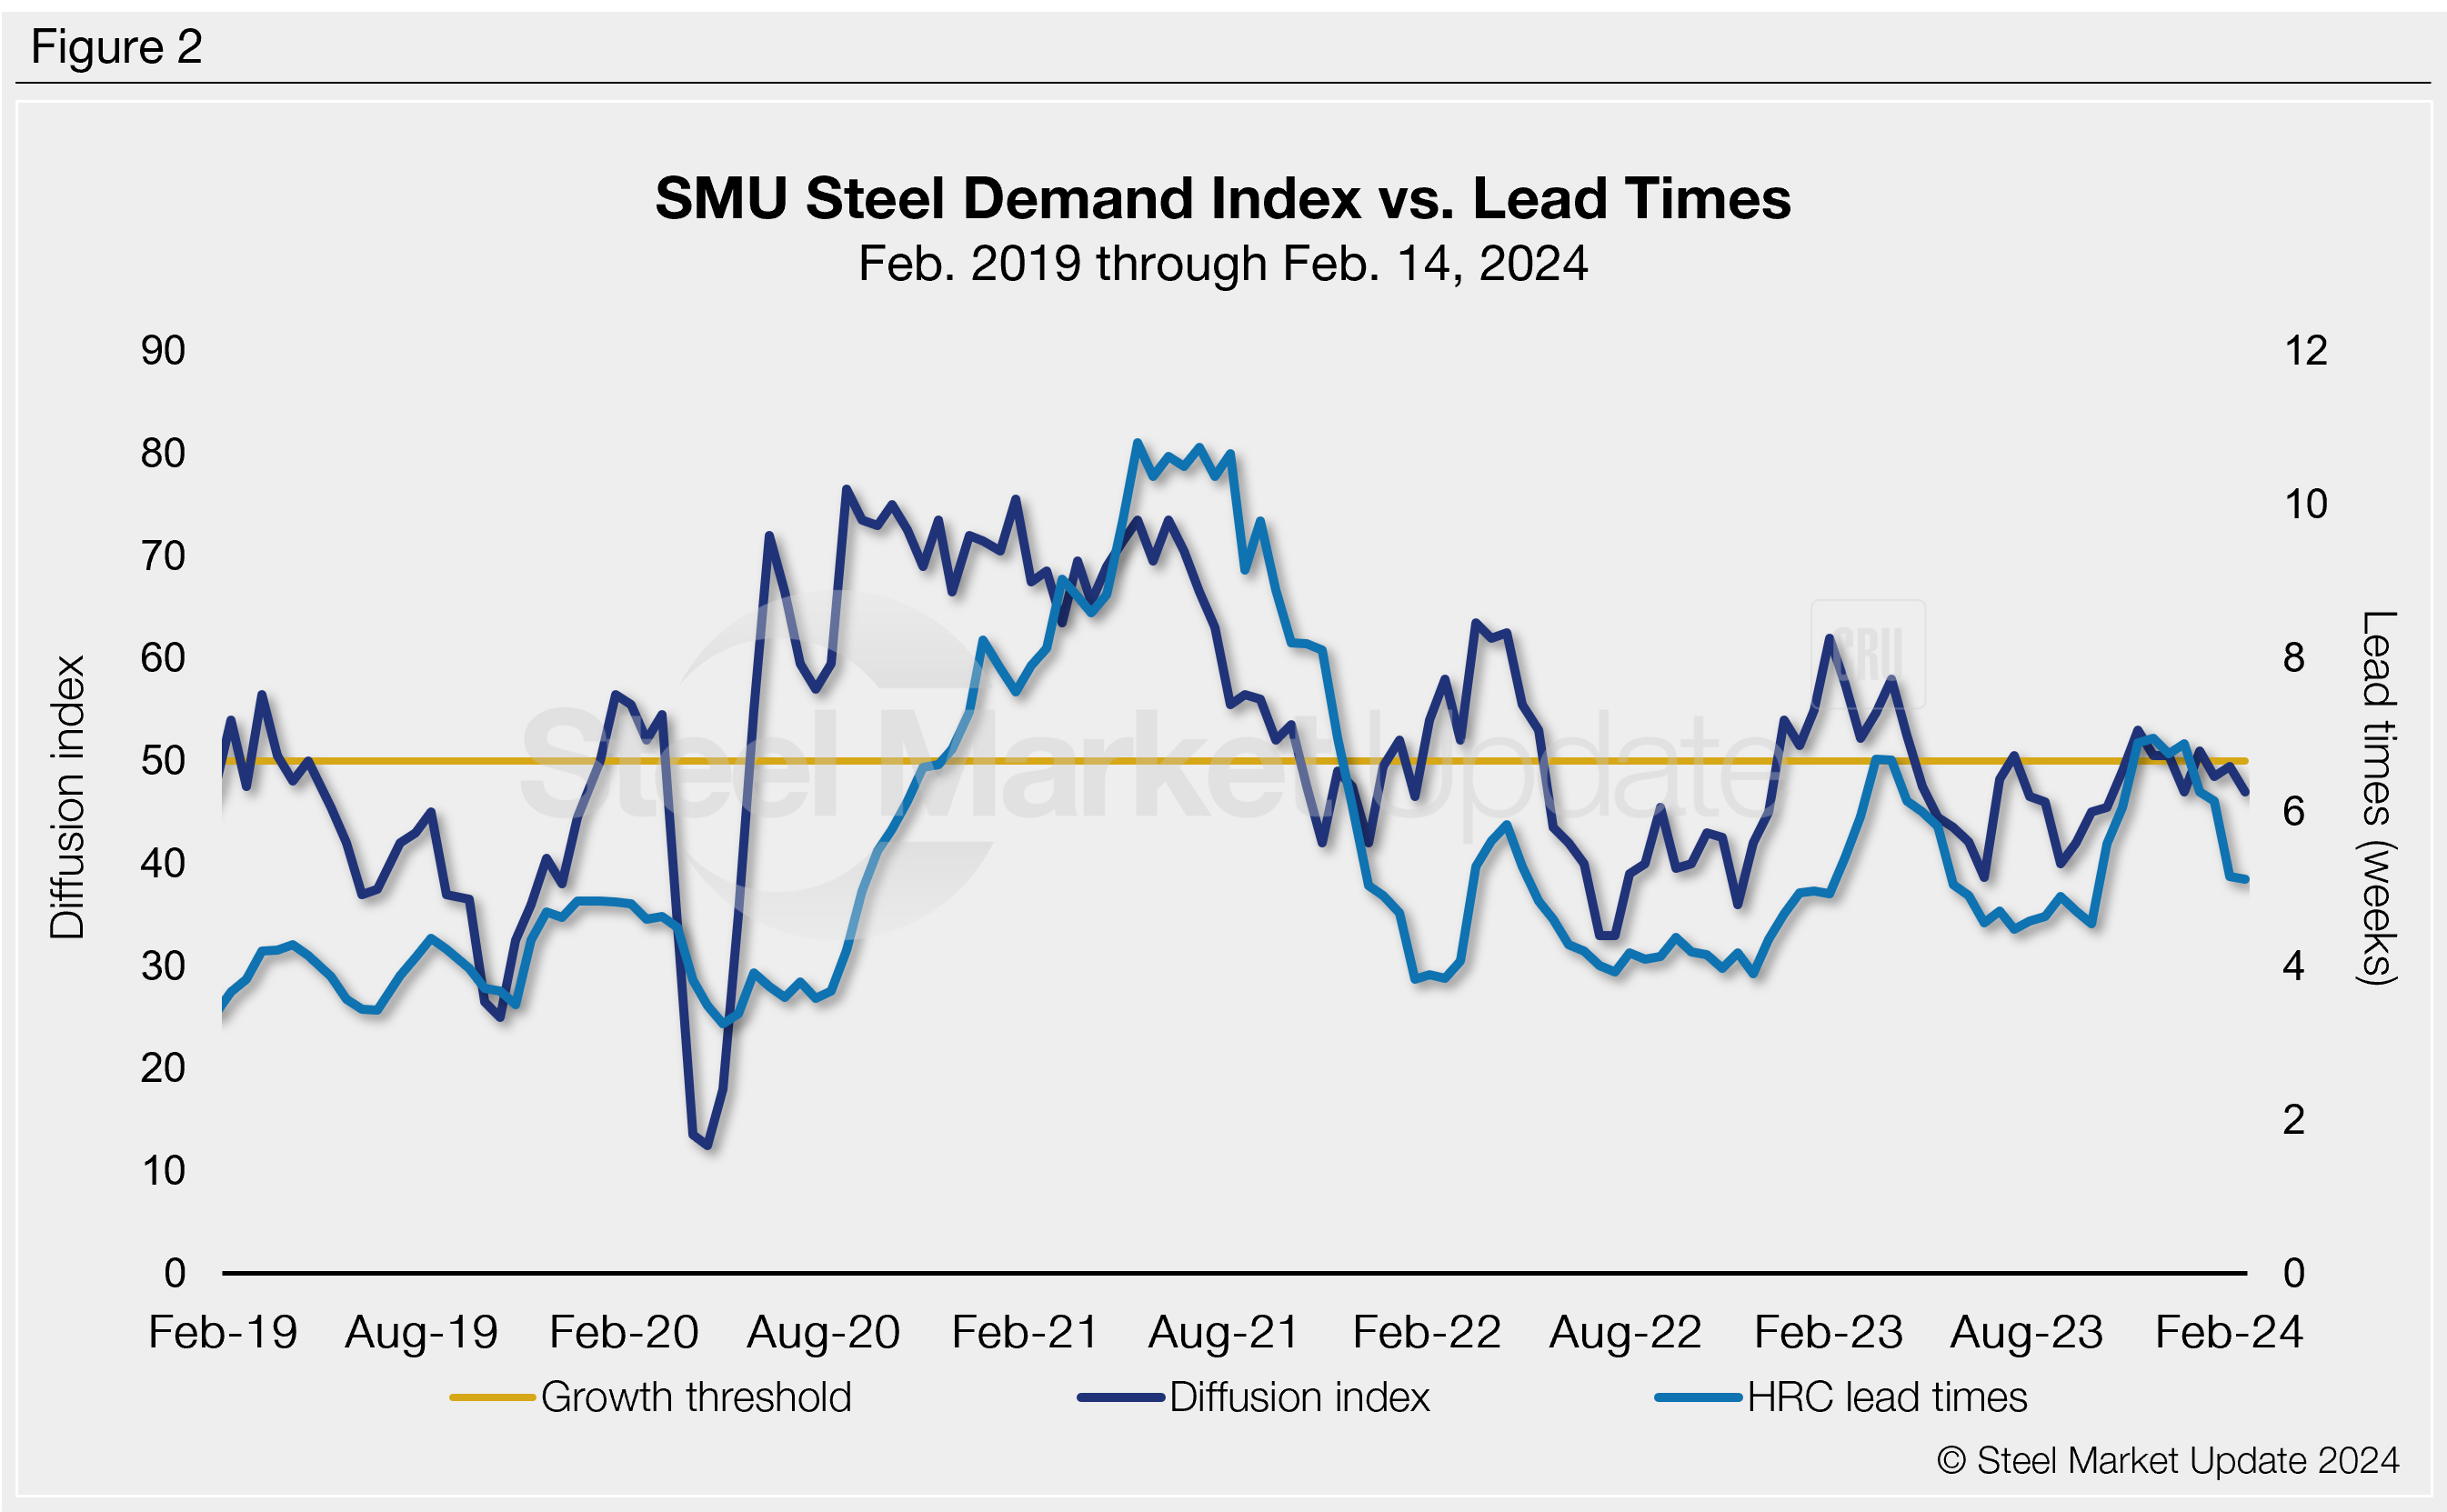
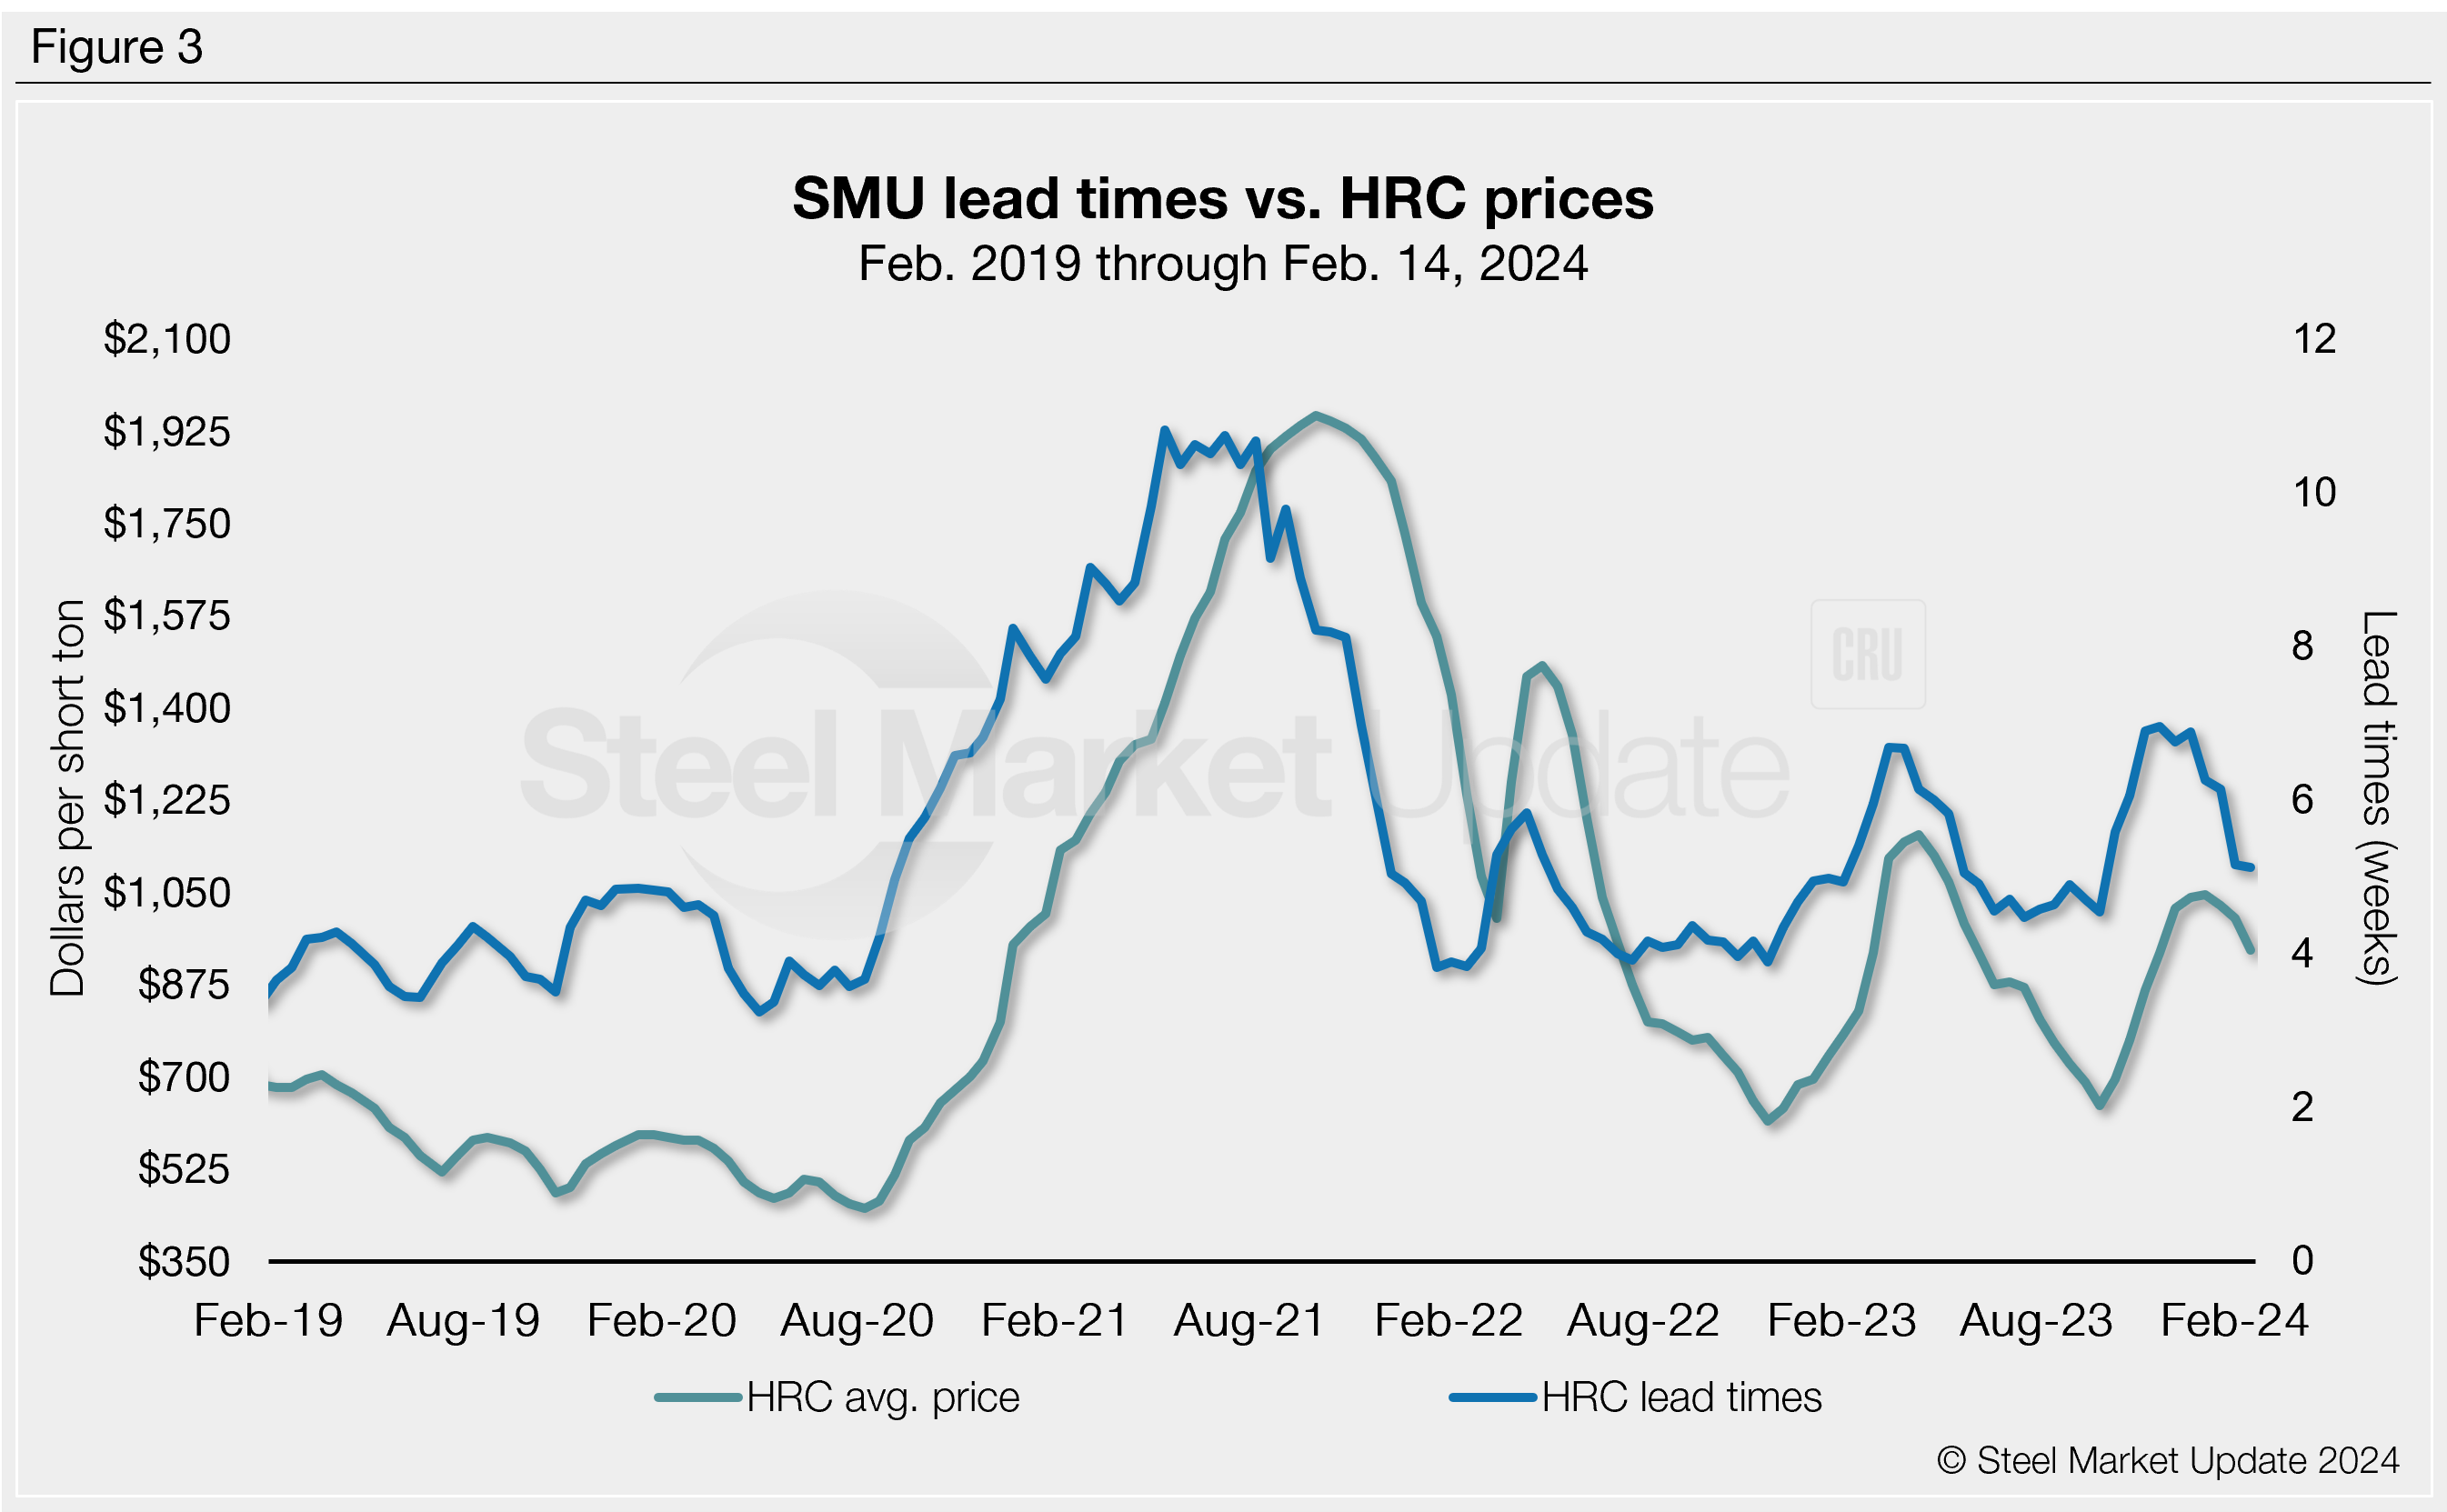
It’s important to note that SMU’s demand diffusion index has, for nearly a decade, preceded moves in steel mill lead times (Figure 2), and SMU’s lead times have also been a leading indicator for flat-rolled steel prices, particularly HRC (Figure 3).
What to watch for
I’m afraid to say it, but it’s still lead times. After they pushed out a bit in late December, SMU’s survey results have since shown lead times to be on a steady decline. Our hot-rolled lead times are presently averaging right around five weeks, with several inputs between three and four weeks. They are nearly two weeks below 2023’s high of 6.96 weeks and pointing lower.
With prices still declining, will lead times continue to wane, and what does that mean for overall underlying demand as we move closer to Q2?
Note: Demand, lead times, and prices are based on the average data from manufacturers and steel service centers that participate in SMU’s market trends analysis surveys. Our demand and lead times do not predict prices but are leading indicators of overall market dynamics and potential pricing dynamics. Look to your mill rep for actual lead times and prices.


